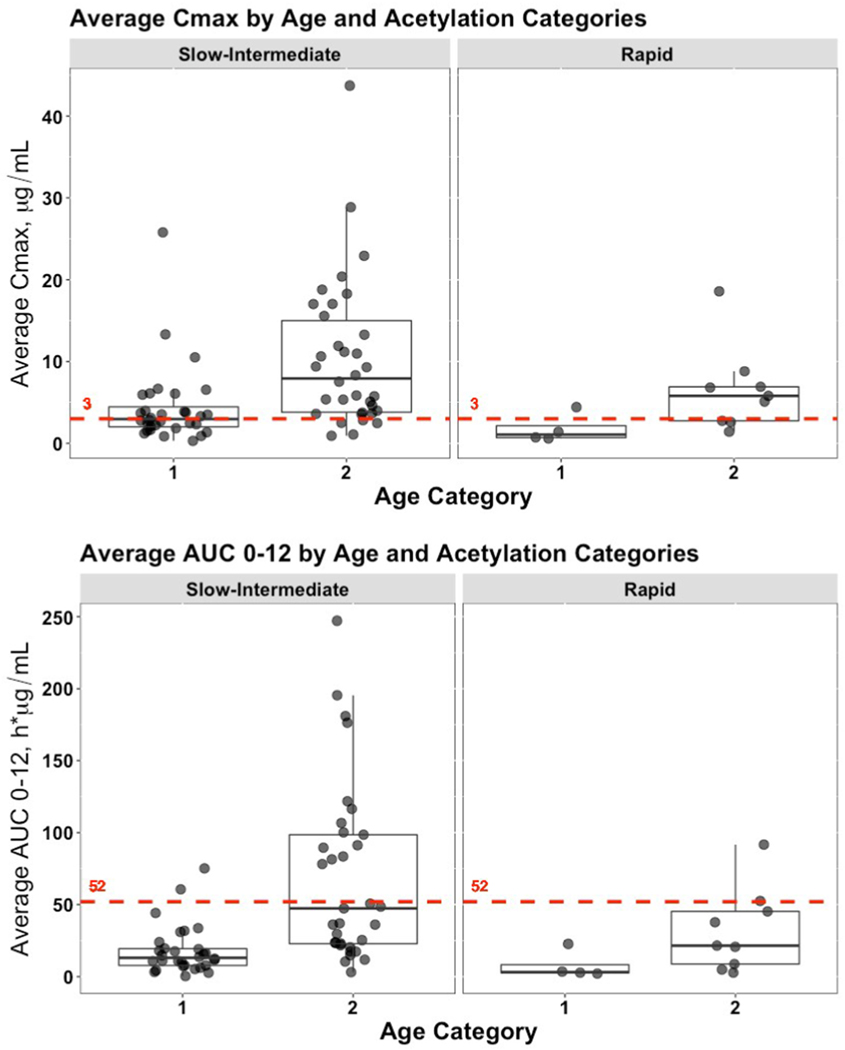
Fig. 2. INH exposure analyzed by predicted NAT2 acetylator phenotype.
Genotype information at c.341 and c.590 were converted to NAT2 haplotypes/alleles and predicted NAT2 acetylator phenotypes and then used to analyze available average Cmax (μg/mL) and average AUC0–12 (h*μg/mL) values. Data was further stratified according to the same age categories used in Fig. 1. Each marker represents an individual participant. A) Cmax; B) AUC0–12. The red, dashed line in each subplot represents the target expected exposure level for adult patients.

