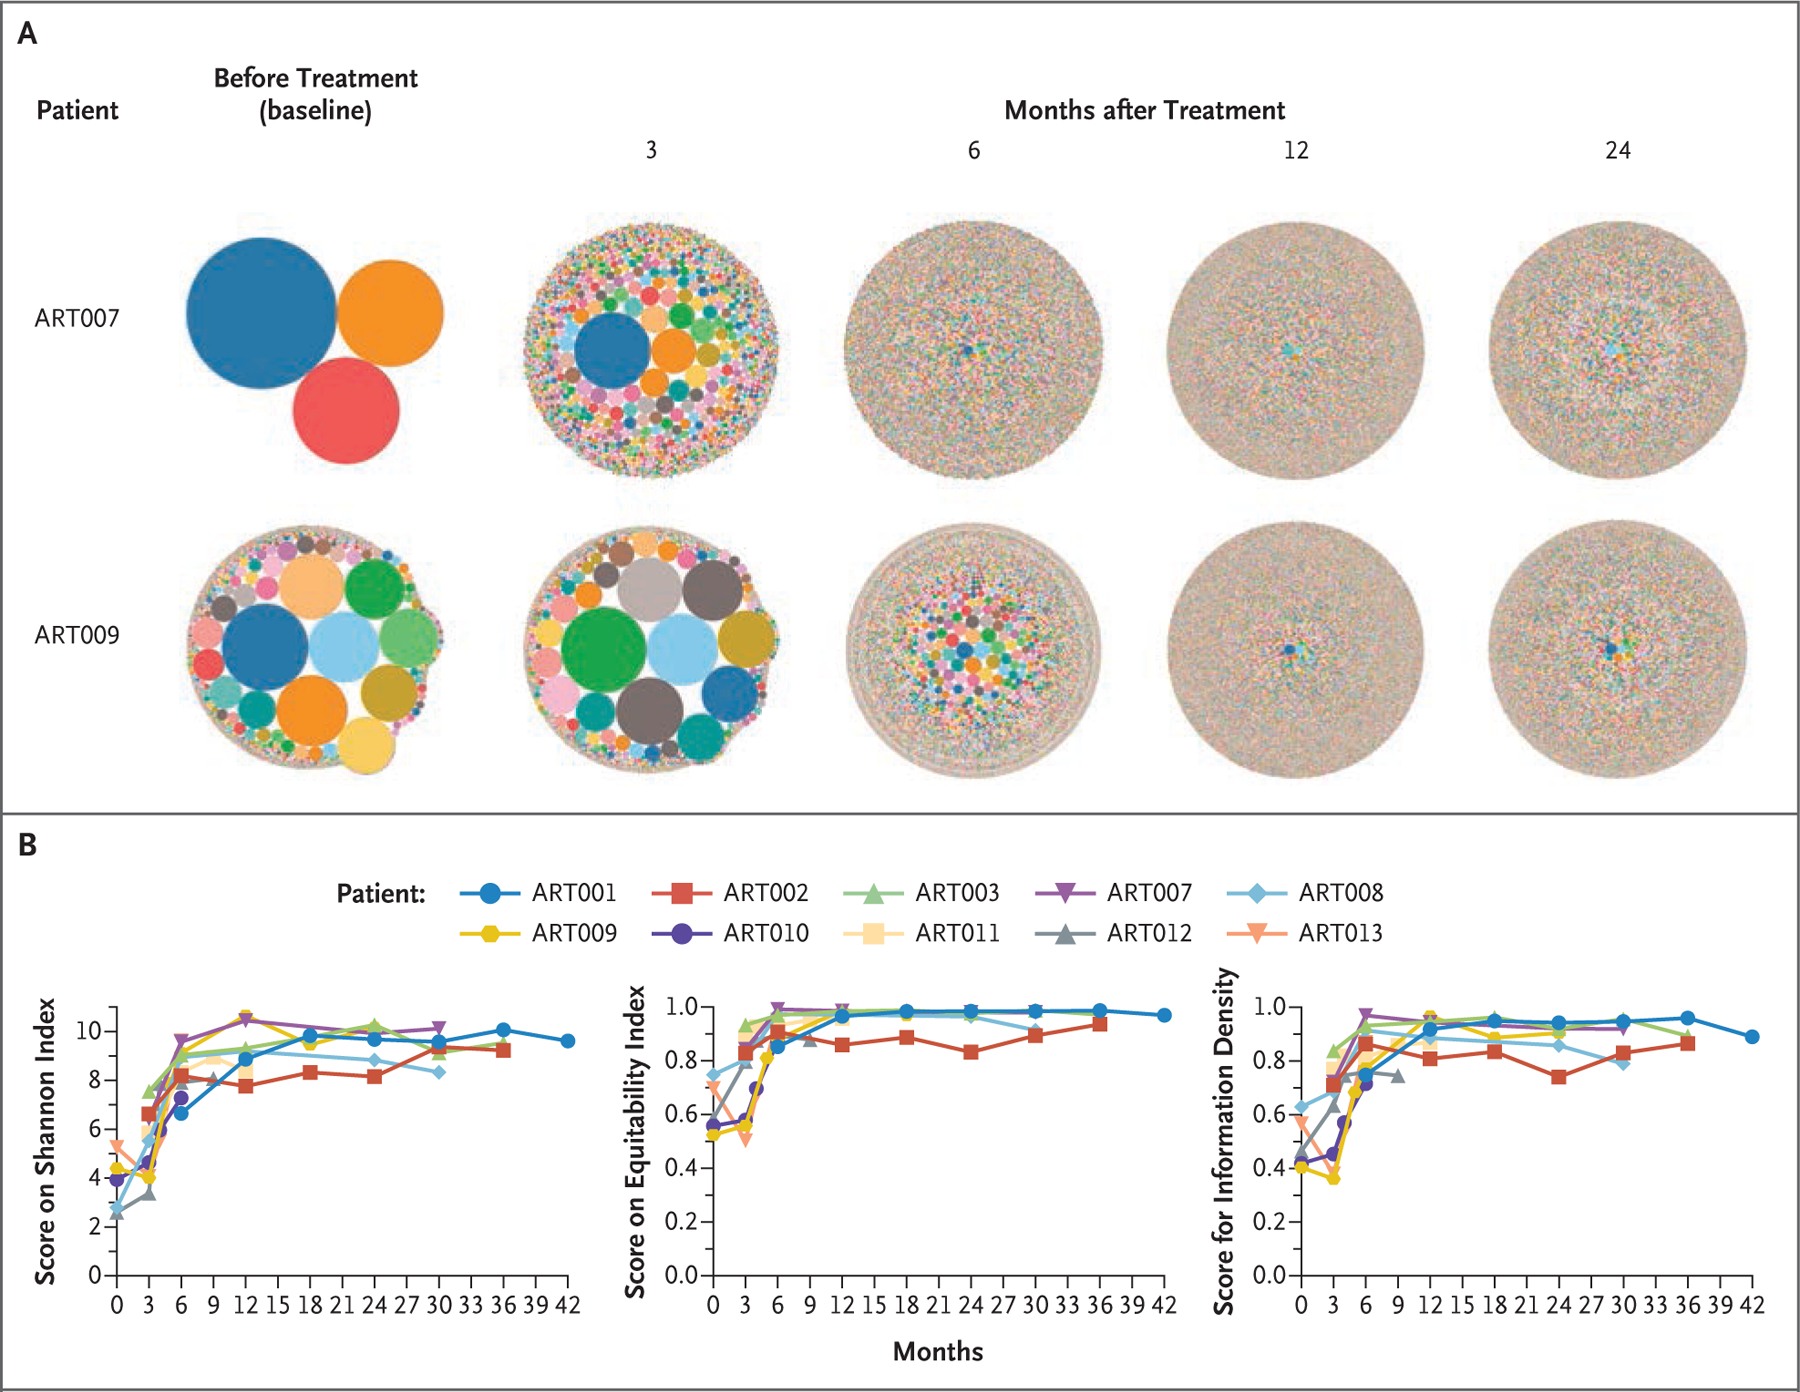
Figure 2. Diversity of T-Cell Receptor β-Chain Variable Sequences at Baseline and after Infusion of CD34+ Gene-Corrected Cells.

Panel A shows hierarchical tree maps of sequence diversity in Patients ART007 and ART009 from baseline to 36 months after infusion. Panel B shows serial measurements of scores on the Shannon index (the range includes all numbers >0), scores on the equitability index (range, 0 to 1), and scores for information density (range, 0 to 1); for all three scales, higher values indicate greater diversity. Scores on all three scales increased during the first 6 to 12 months after infusion, and these increases were then sustained. Details are provided in Figure S5 in the Supplementary Appendix.
