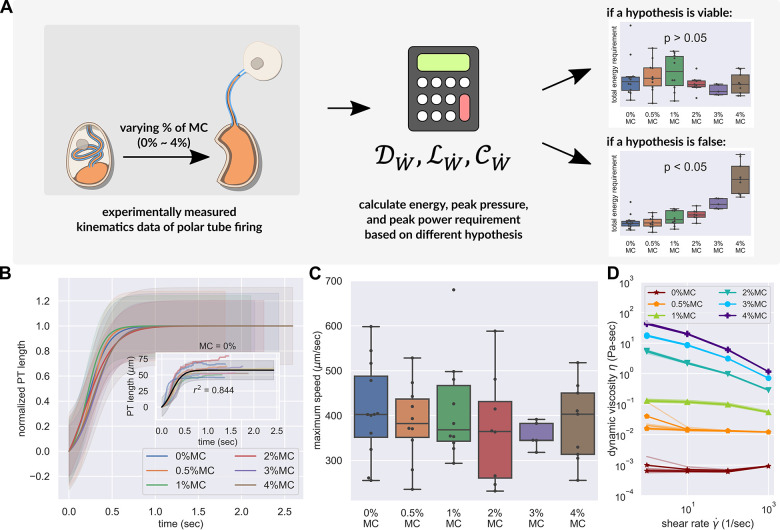
Figure 4:
PT firing kinematics in the presence of varying external viscosity. (A) Schematic outlining the protocol for hypothesis testing. We experimentally measured the PT firing kinematics of A. algerae spores in buffers with varying viscosity, by varying the methylcellulose (MC) concentrations up to 4%. We next calculated the required total energy, peak pressure and peak power for each experimentally measured data according to our physical framework proposed in Figure 3 (and Figure S2), and we see if the required energy, pressure or power changes with respect to changes in surrounding viscosity. We assume that changing surrounding viscosity should not change the ability of the spores to generate energy, pressure or power. Thus if the calculated energy, pressure or power requirement changes significantly with respect to changes in surrounding viscosity (p < 0.05), the hypothesis is inconsistent with experimental observations. (B) Experimental measurement of PT ejection kinematics of A. algerae spores in different concentrations of methylcellulose. The kinematics was fit to a sigmoid function and then normalized by L. The additional term in the sigmoid function is to ensure the curve passes the origin. (0%: n=12; 0.5%: n=10; 1%: n=10; 2%: n=8; 3%: n=5; 4%: n=9) The inset shows the original data in MC0%. The changes in MC concentration does not cause obvious changes in overall kinematics of PT firing. The complete set of original data can be found in Supplementary Figure S4. (C) The dependence of maximum PT ejection velocity on MC concentration in germination buffer. Increasing MC concentration up to 4% does not change the maximum PT ejection velocity. (p=0.848, Kruskal–Wallis test)(D) Viscosity measurements of germination buffer with various concentrations of methylcellulose, corresponding to the concentrations used in PT extrusion experiments. As the PT ejection process is a high shear rate phenomenon (~3000 1/sec), we used the measurement at shear rate . The maximum tested shear rate was 1000 sec−1 as that reaches the operation limit of the shear rheometer. (n = 5 for 0%, 0.5%, 1%. n = 3 for 2%, 3%, 4%.)

