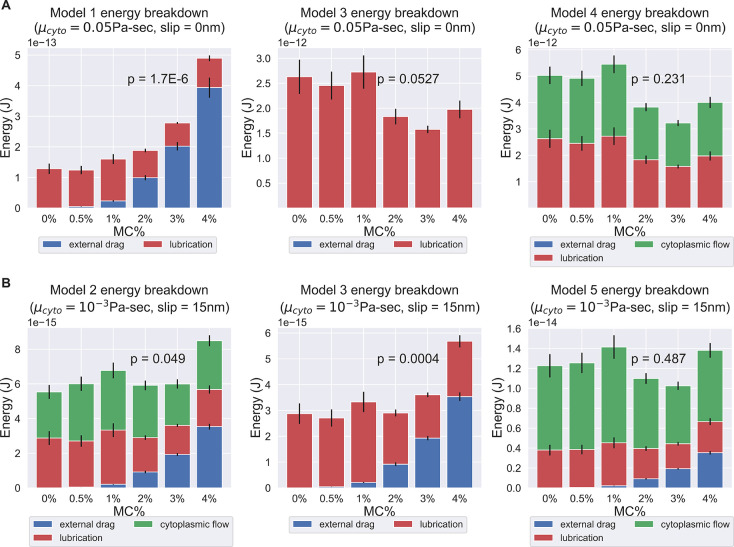
Figure 6:
Energy breakdown of different hypothesis. (A) Energy breakdown of Model 1, 3, and 4 assuming a cytoplasmic viscosity of 0.05 Pa-sec and a 0 slip length at all boundaries. Under this condition, Model 1 and Model 3 are rejected. In Model 1, the scaling of external drag with respect to surrounding viscosity was too strong to explain the observed PT firing kinematics. In Model 3, the energy contribution mostly comes from lubrication alone, but the variation is too large to explain the experimentally observed kinematics. On the contrary, in Model 4, the external drag did not scale unfavorably with respect to changes in surrounding viscosity, and the variations in energy dissipation from lubrication and cytoplasmic flow balance out each other and thus does not contradict the experimental data. (B) Energy breakdown of Model 2, 3, and 5 assuming a cytoplasmic viscosity of 0.001 Pa-sec and a slip length of 15 nm at all boundaries. Under this condition, Model 1, Model 2 and Model 3 are rejected. In both Model 2 and Model 3, under a lower cytoplasmic viscosity and larger slip boundary length, the scaling effect of external drag with respect to surrounding viscosity starts to manifest. As these two models did not account enough energy terms to balance out the changes in external drag, they contradict with our experiment data. Model 4 and Model 5, on the other hand, account for more energy terms and thus mask out the effect of increased external drag, and are consistent with experiment data. The comprehensive p-values of different cytoplasmic viscosity and different slip length was shown in Table 1 and Table 2.

