Figure 3.

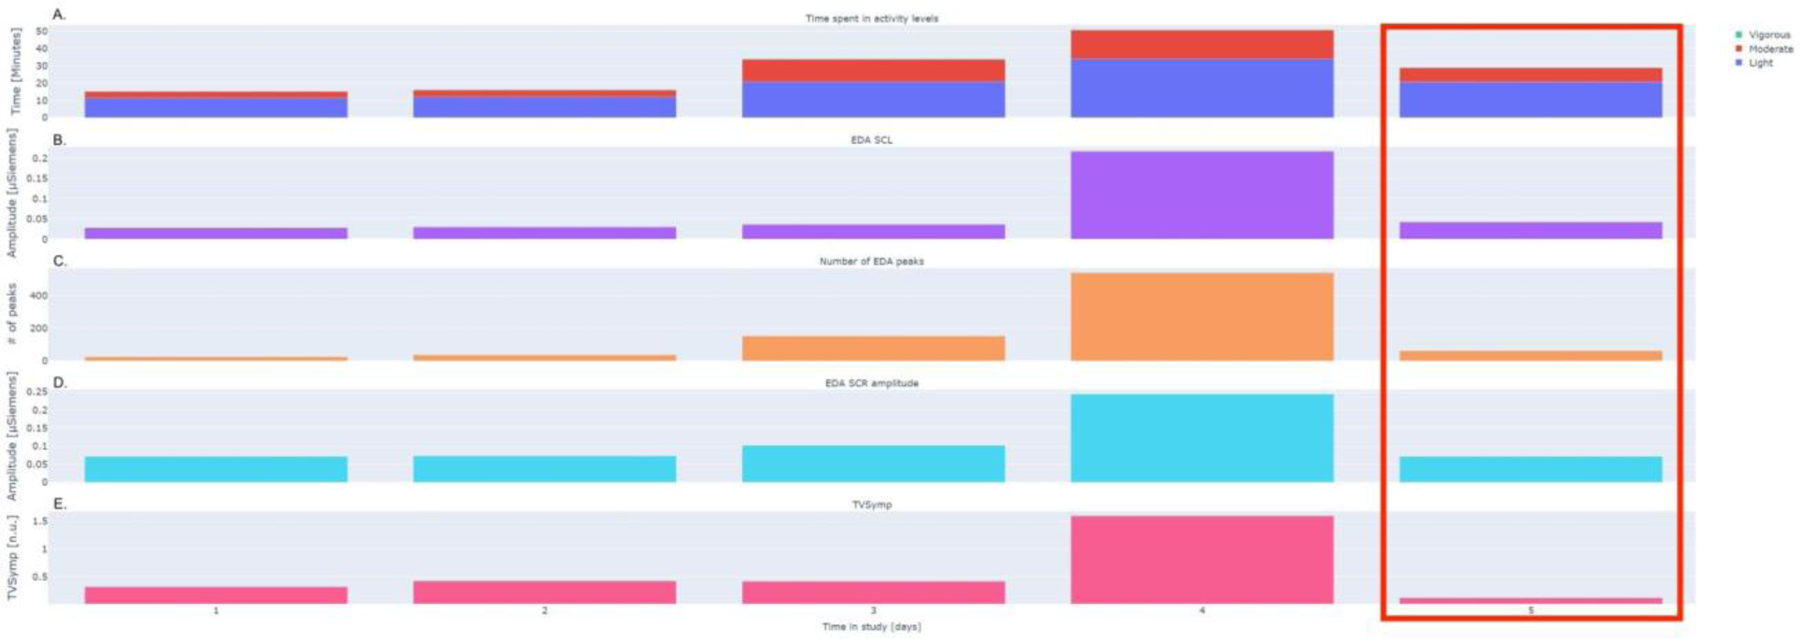
Physiology and activity data streams over time. Note: the attempt occurred on day 5.
(A) Time at different activity levels (Light, Moderate and Vigorous) aggregated over morning hours (6am - noon) computed from accelerometer data;
(B) Average Electrodermal Activity (EDA) Skin Conductance Level (SCL) during morning hours;
(C) Number of EDA peaks during morning hours;
(D) Average EDA Skin Conductance Response (SCR) peaks amplitude during morning hours;
(E) Time-varying EDA index of sympathetic control (TVSymp) computed during morning hours by using the mean spectral amplitudes in the frequency band associated with sympathetic tone of the EDA.
Note: The red box indicates the day of the suicide attempt.
