Figure 1.
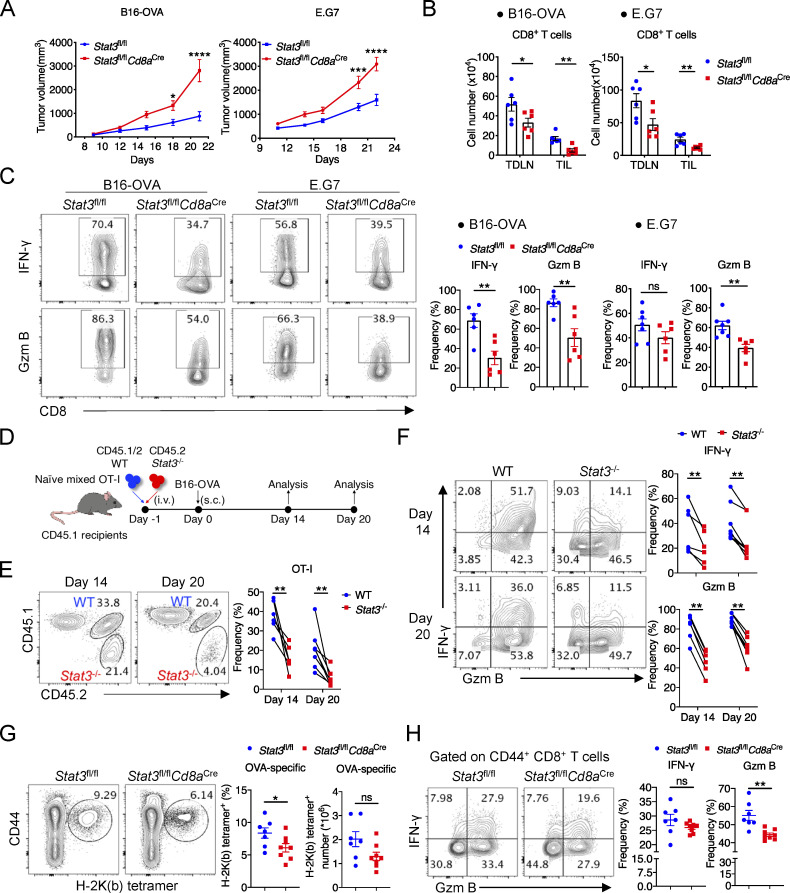
STAT3 promotes the effector function of CD8+ T cells. (A) Mean volumes of B16-OVA tumors (left panel) in Stat3fl/fl (n = 6) and Stat3fl/flCd8aCre (n = 6) mice, or E.G7 tumors (right panel) in Stat3fl/fl (n = 7) and Stat3fl/flCd8aCre (n = 6) mice. (B) Numbers of CD8+ T cells in TDLNs and tumors from Stat3fl/fl and Stat3fl/flCd8aCre mice. (C) Representative plots (left panel) and quantifications (right panel) of IFN-γ and Granzyme B production in CD44+PD-1+ CD8+ TILs from B16-OVA (left panel) or E.G7 (right panel) tumors. (D) Experimental design for adoptive cotransfer of naive WT and Stat3−/− OT-I cells and B16-OVA tumor–challenge assay. (E) OT-I TIL frequencies among total CD8+TILs from B16-OVA tumors on day 14 and day 20 after tumor inoculation. (F) Representative plots (left panel) and quantifications (right panel) of IFN-γ and Granzyme B production in OT-I TILs from B16-OVA tumors. (G) Frequencies of OVA-specific CD8+ T cells and their numbers (P = 0.0590) in LM-OVA–infected Stat3fl/fl and Stat3fl/flCd8aCre mice on day 8. (H) Representative plots (left panel) and quantifications (right panel) of IFN-γ and Granzyme B production in splenic CD44+ CD8+ T cells on day 8 after LM-OVA infection. Data are representative of two (A [left], B [left], C [left], G, and H) or three (A [right], B [right], C [right], and D–F) independent experiments. Data are shown as mean ± SEM. *, P < 0.05; **, P < 0.01; ***, P < 0.001; ****, P < 0.0001 by two-way ANOVA (A), unpaired two-tailed Student’s t test (B, C, G, and H), or paired two-tailed Student’s t test (E and F).

