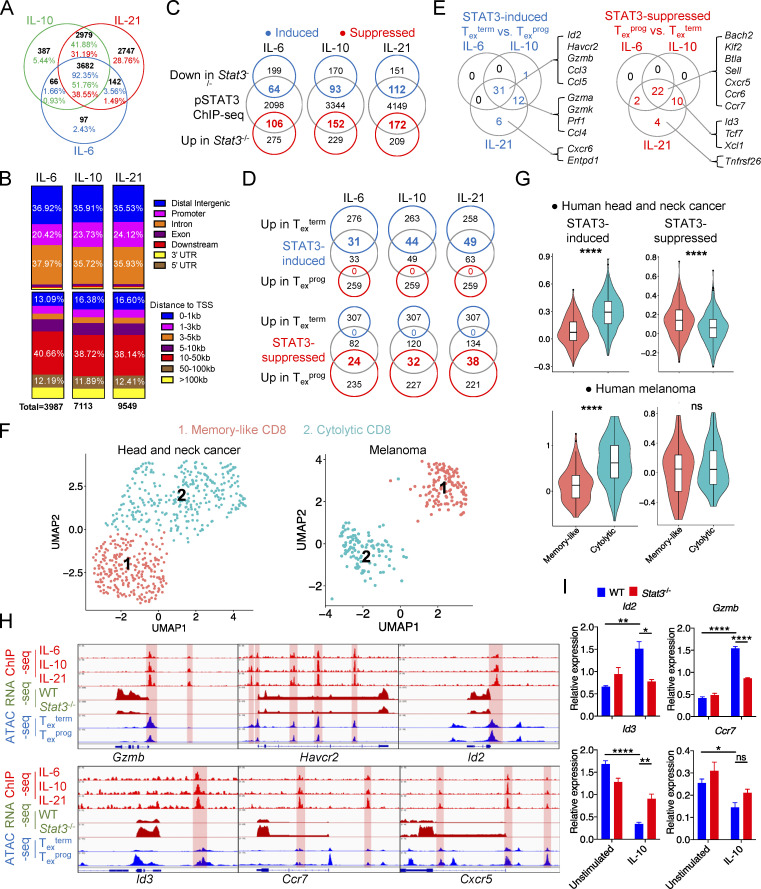
Figure 5.
STAT3 transcriptionally regulates Tex cell differentiation. (A) Venn diagram of pSTAT3-binding peaks in IL-6–, IL-10–, and IL-21–stimulated CD8+ T cells across the whole mouse genome (mm10). (B) Genetic feature distribution (upper panel) or distribution relative to TSS (bottom panel) of pSTAT3-binding peaks in CD8+ T cells. (C) Venn diagrams of pSTAT3-binding genes and DEGs in WT or Stat3−/− CD8+ OT-I TILs. (D) Venn diagrams of STAT3-regulated genes and DEGs in Texterm or Texprog TILs (GEO accession no. GSE114631). (E) Representative STAT3-regulated feature genes of Texterm (left panel) or Texprog (right panel) cells. (F) UMAP plots identifying tumor-infiltrating memory-like and cytolytic CD8+ T cell clusters from human head and neck cancer (left panel) or melanoma (right panel) patient (GEO accession nos. GSE103322 and GSE120575). (G) Average expression of STAT3-induced (left panel) or -suppressed (right panel) signature gene clusters in memory-like or cytolytic tumor-infiltrating CD8+ T cells. STAT3-induced or -suppressed signature genes are listed in Table S3. (H) pSTAT3 ChIP-seq tracks aligned with RNA-seq tracks of WT and Stat3−/− CD8+ TILs, and ATAC-seq tracks of Texprog or Texterm cells at the specific gene loci (GEO accession no. GSE123236). (I) mRNA levels of specific genes in in vitro activated WT and Stat3−/− CD8+ T cells with the stimulation of IL-10 for 2 d or not. Data are representative of three (I) independent experiments. Data are shown as mean ± SEM. *, P < 0.05; **, P < 0.01; ***, P < 0.001; ****, P < 0.0001 by unpaired two-tailed Student’s t test (G and I).

