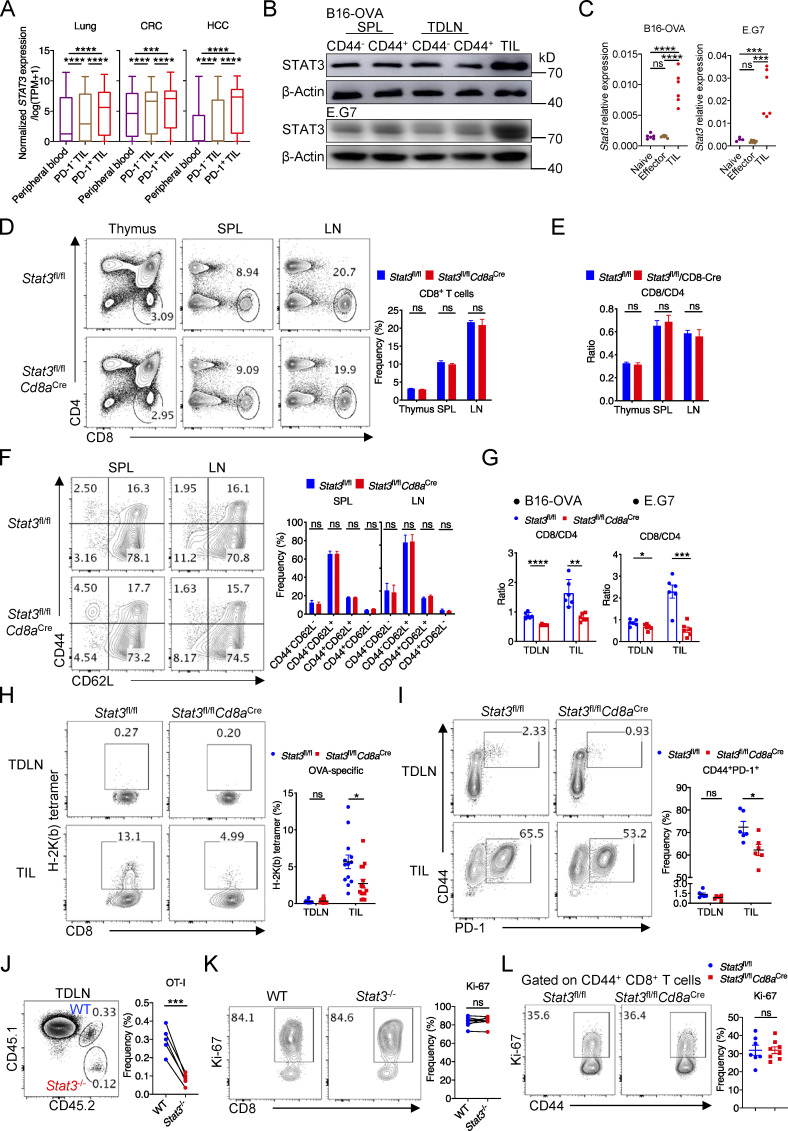
Figure S1.
STAT3 is intrinsically critical for the effector function of CD8+ T cells. (A) mRNA level of STAT3 in CD8+ T cells from peripheral blood or tumors in human cancer patients (GEO accession nos. GSE99254, GSE108989, and GSE98638). scRNA-seq data of CD8+ T cells in tumors and peripheral blood from lung, CRC, and HCC patients were previously processed and uploaded by others (http://crc.cancer-pku.cn/, http://hcc.cancer-pku.cn/, http://lung.cancer-pku.cn/; Guo et al., 2018; Zhang et al., 2018; Zheng et al., 2017), and we obtained the STAT3 expression values from the above websites. The expression unit was normalized expression/log2(TPM+1). We compared the STAT3 expression values in CD8+ T cells from peripheral blood, and in PD-1–negative (PDCD1 expression value = 0) and –positive (PDCD1 expression value >0) CD8+ T cells from tumors. (B) STAT3 protein expression in CD8+ T cells from spleens, TDLNs, and tumors in B16-OVA (upper plot) and E.G7 (bottom plot) models. (C) mRNA levels of Stat3 in CD8+ T cells from TDLNs and tumors in B16-OVA (left panel) and E.G7 (right panel) models. (D) Frequencies of CD8+ T cells in thymuses, spleens, and lymph nodes in 6- to 8-wk-old Stat3fl/fl (n = 5) and Stat3fl/flCd8aCre (n = 5) mice. (E) Ratios of CD8+ T cells to CD4+ T cells in the thymuses, spleens, and lymph nodes from 6- to 8-wk-old Stat3fl/fl (n = 5) and Stat3fl/flCd8aCre (n = 5) mice. (F) Representative plots (left panel) and quantifications (right panel) of CD44 and CD62L expression on CD8+ T cells in the spleens and lymph nodes from 6- to 8-wk-old Stat3fl/fl (n = 5) and Stat3fl/flCd8aCre (n = 5) mice. (G) Ratios of CD8+ T cells to CD4+ T cells in TDLNs and tumors. (H) Representative plots (left panel) and quantifications (right panel) of H-2K(b) tetramer+ CD8+ T cells among total CD8+ T cells from TDLNs and E.G7 tumors. (I) Representative plots (left panel) and quantifications (right panel) of CD44+ PD-1+ CD8+ T cells among total CD8+ T cells from TDLNs and E.G7 tumors. (J) OT-I TIL frequencies among total CD8+T cells from TDLNs in B16-OVA model on day 20 after tumor inoculation. (K) Representative plots (left panel) and quantifications (right panel) of Ki-67 expression in OT-I TILs from B16-OVA tumors on day 20 after tumor inoculation. (L) Representative plots (left panel) and quantifications (right panel) of Ki-67 expression in splenic CD44+ CD8+ T cells on day 8 after LM-OVA infection. Data are pooled from three independent experiments (H), or are representative of two (B–F, G [left], J, and L) or three (G [right], I, and K) independent experiments. Data are shown as mean ± SEM. *, P < 0.05; **, P < 0.01; ***, P < 0.001; ****, P < 0.0001 by one-way ANOVA (A and C), unpaired two-tailed Student’s t test (D–I and L) or paired two-tailed Student’s t test (J and K). Source data are available for this figure: SourceData FS1.

