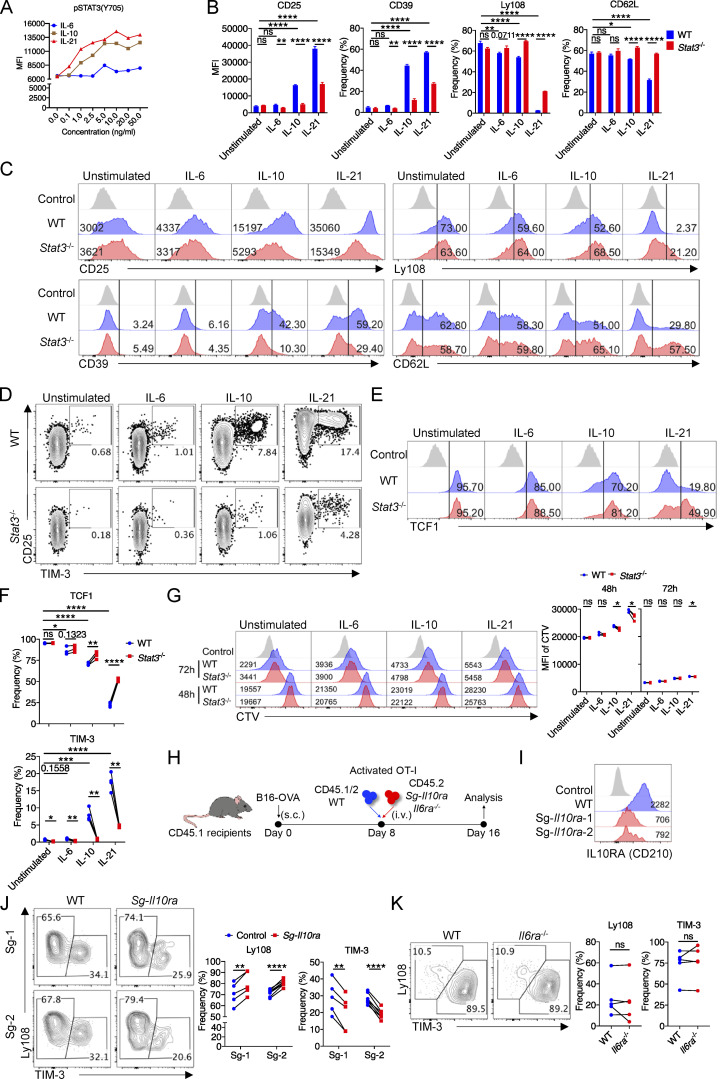
Figure S3.
IL-10 and IL-21 signaling intrinsically promotes the development of Texterm cells. (A) Phosphorylation levels of STAT3 at the Y705 site in in vitro activated CD8+ T cells with the stimulation of IL-6, IL-10, or IL-21 for 30 min. (B and C) Quantifications (B) and representative plots (C) and of CD25, CD39, Ly108, and CD62L expression on in vitro–stimulated WT and Stat3−/− CD8+ T cells. (D–F) Representative plots (D and E) and quantifications (F) of TIM-3 and TCF1 expression on/in in vitro cocultured WT and Stat3−/− CD8+ T cells with the stimulation of IL-6, IL-10, or IL-21 for 3 d. (G) Proliferation of in vitro cocultured WT and Stat3−/− CD8+ T cells marked by CTV dilution. (H) Experimental design for adoptive cotransfer of WT and Sg-Il10ra or Il6ra−/− OT-I cells and B16-OVA tumor–challenge assay. (I) Representative plots of IL10RA (CD210) expression on WT and Sg-Il10ra OT-I TILs from B16-OVA tumors. (J) Representative plots (left panel) and quantifications (right panel) of Ly108 and TIM-3 expression on WT and Sg-Il10ra OT-I TILs from B16-OVA tumors. (K) Representative plots (left panel) and quantifications (right panel) of Ly108 and TIM-3 expression on WT and Il6ra−/− OT-I TILs from B16-OVA tumors. Data are representative of three (B–F, I, and K) or two (A, G, and J) independent experiments. Data are shown as mean ± SEM. *, P < 0.05; **, P < 0.01; ***, P < 0.001; ****, P < 0.0001 by unpaired two-tailed Student’s t test (B) and paired two-tailed Student’s t test (F, G, J, and K).

