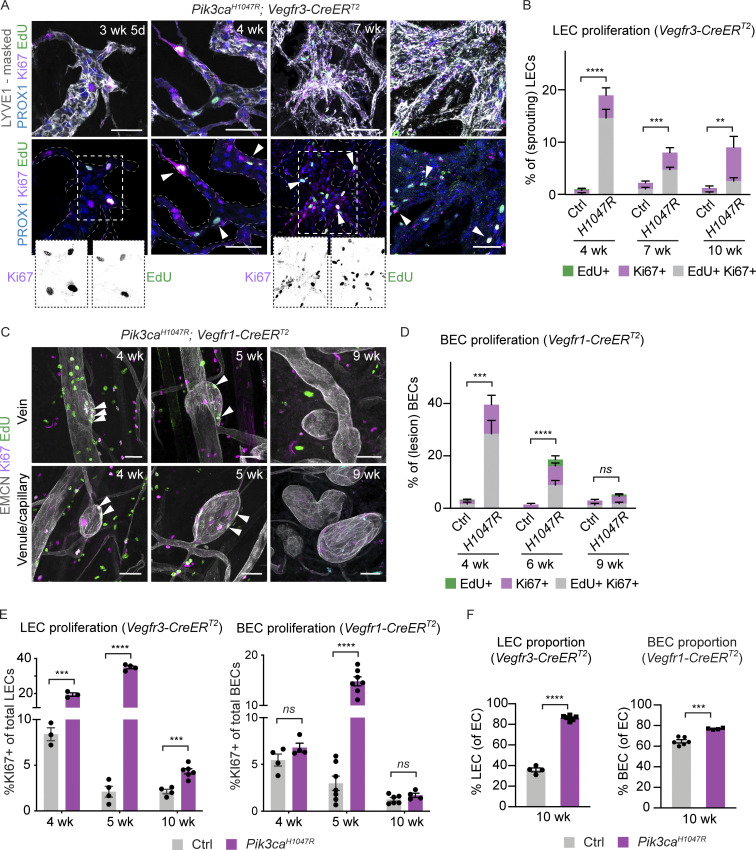
Figure 3.
Different proliferation dynamics of LECs and BECs during Pik3ca-driven vascular overgrowth. (A–D) Whole-mount immunofluorescence of ear skin analyzed at different stages after 4-OHT administration, and quantification of S-phase cells (EdU+) and all cycling cells (Ki67+; arrowheads) in Pik3caH1047R;Vegfr3-CreERT2 (A and B) and Pik3caH1047R;Vegfr1-CreERT2 (C and D) mice. EdU was administered 16 h prior to analysis. LYVE1 and PROX1 were used for the identification of LECs, and EMCN for the identification of (venous) BECs. IMARIS surface mask based on LYVE1 expression was used to extract LEC-specific Ki67/EdU signals. The original unmasked images are shown in Fig. S2 F. Note initial proliferative response in both models, but sustained proliferation only in the LECs of Vegfr3-CreERT2 mice. (E) Flow cytometry analysis of proliferating dermal LECs and BECs in Pik3caH1047R;Vegfr3-CreERT2 and Pik3caH1047R;Vegfr1-CreERT2 mice, respectively, and their littermate controls at the indicated stages. Data represent mean % of Ki67+ ECs (n = 3–7 mice) ± SEM. (F) Proportion of LECs and BECs out of all ECs in the Pik3caH1047R;Vegfr3-CreERT2 and Pik3caH1047R;Vegfr1-CreERT2 animals analyzed in E. P value in B and D–F: two-tailed unpaired Student’s t test; ****, P < 0.0001; ***, P < 0.001; **, P < 0.01; ns, P > 0.05. Scale bar: 50 μm (A and C).

