Figure 8.
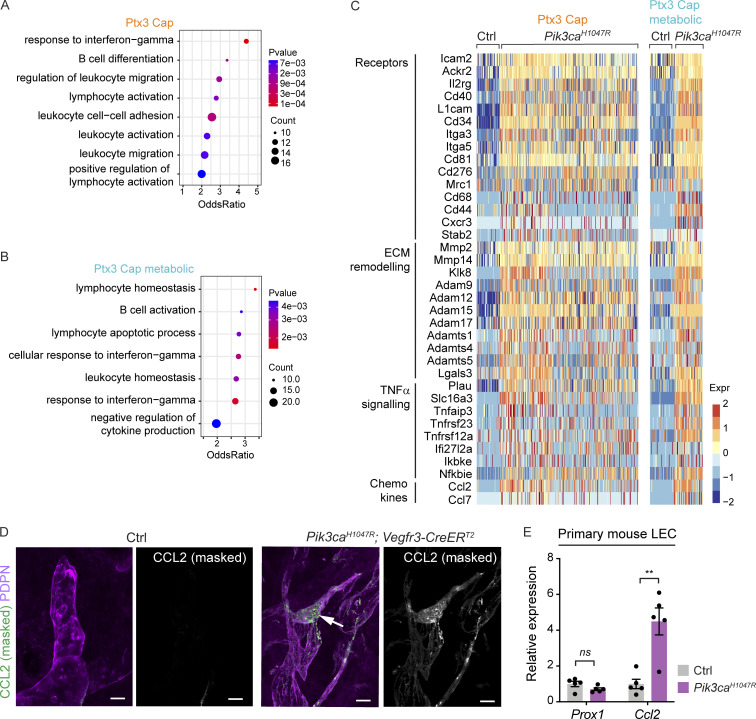
Pro-inflammatory transcriptome of Pik3caH1047R -expressing iLECs. (A and B) GO analysis of genes enriched in the clusters of non-proliferative Ptx3+ capillary LECs from Pik3caH1047R in comparison with Ptx3+ capillary LECs in control mice. Selected terms for enriched immune-related biological process are shown. Dot size illustrates count number and color illustrates adjusted P value. (C) Heatmap showing the expression of upregulated immune-related genes in Ptx3+ capillary LECs from Pik3caH1047R mutant in comparison with control mice. Color illustrates the expression level (log2 fold change). (D) Whole-mount immunofluorescence of Pik3caH1047R;Vegfr3-CreERT2 ear skin showing lymphatic endothelial expression of CCL2/MCP1 in the mutant. (E) qRT-PCR analysis of primary dermal LECs isolated from Pik3caH1047R;Vegfr3-CreERT2 ears, showing increased Ccl2 expression in Pik3caH1047R-expressing (with 4-OHT) in comparison with control (without 4-OHT) LECs. Prox1 levels were unchanged. Data represent mean relative expression (normalized to Hprt; n = 5 samples) ± SEM, presented relative to control cells. P value obtained using hypergeometric test (A and B) and two-tailed unpaired Student’s t test (E). **, P < 0.01; ns, P > 0.05. Scale bars: 20 μm (D).

