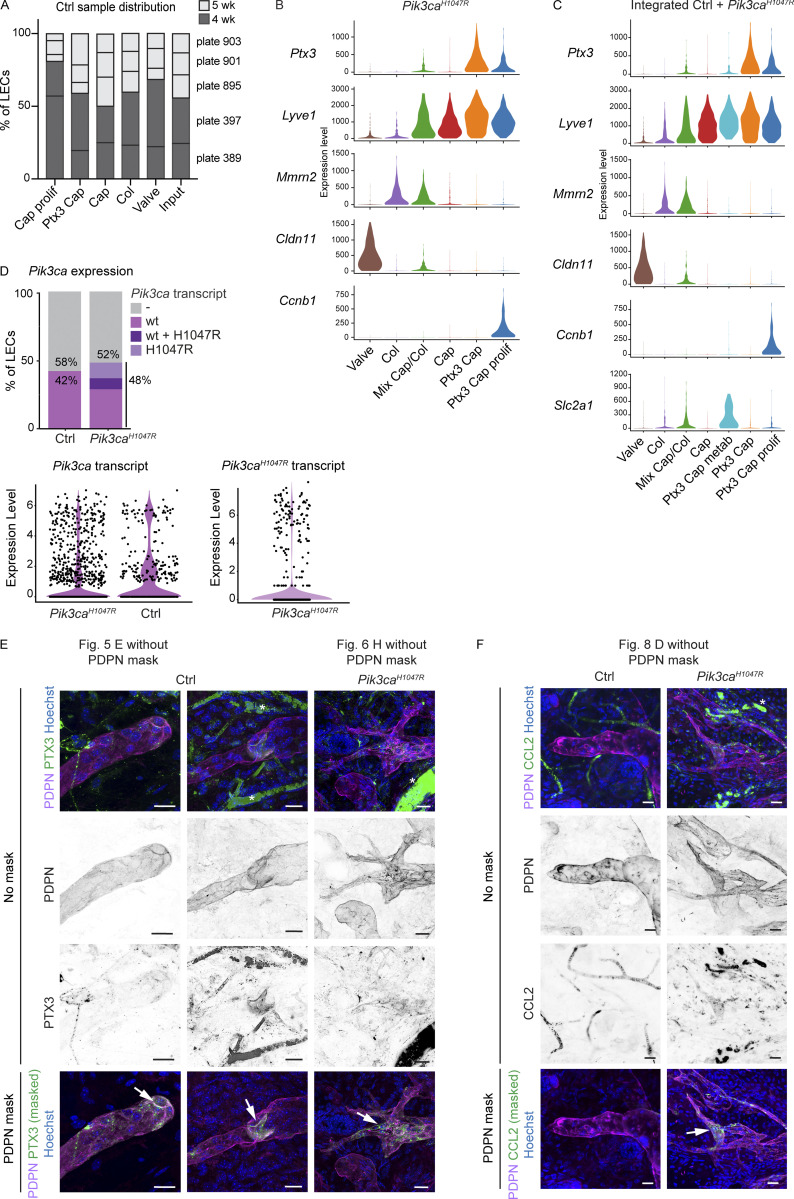
Figure S4.
Characterization of cell clusters in scRNA-seq datasets of Pik3caH1047R mutant and control LECs. (A) Contribution of cells from different control mice (plates) in the five clusters of normal LECs. Input levels of each plate are shown, and color code indicates mouse age. (B and C) Violin plots showing the expression of selected LEC and LEC subtype marker genes in LEC clusters from the Pik3caH1047R mutant dataset (from Fig. 6 A; B) and integrated dataset containing LECs from control and Pik3caH1047R;Cdh5-CreERT2 mice (from Fig. 6 D; C). (D) Proportion of LECs from control and Pik3caH1047R;Cdh5-CreERT2 mice expressing the endogenous mouse Pik3ca transcript (control and mutant mice), and/or the transgenic Pik3caH1047R transcript (mutant mice only). Violin plots below show the expression levels. Note that the majority of LECs lack the Pik3ca transcript. (E and F) Whole-mount immunofluorescence of control and Pik3caH1047R;Vegfr3-CreERT2 ear skin showing high expression of PTX3 (E) and CCL2 (F) in the capillary terminals (Ctrl) and abnormal lymphatic sprouts (mutant; arrows). PTX3 staining is also observed in lymphatic valves (arrow). IMARIS surface mask based on PDPN expression was used to extract LEC-specific signals (images below, shown in the main figures). The original images including single channels for PDPN and PTX3 (E) or CCL2 (F) are shown (no mask). Unspecific signal from red blood cells is indicated by asterisks. Scale bars: 20 µm (E and F).

