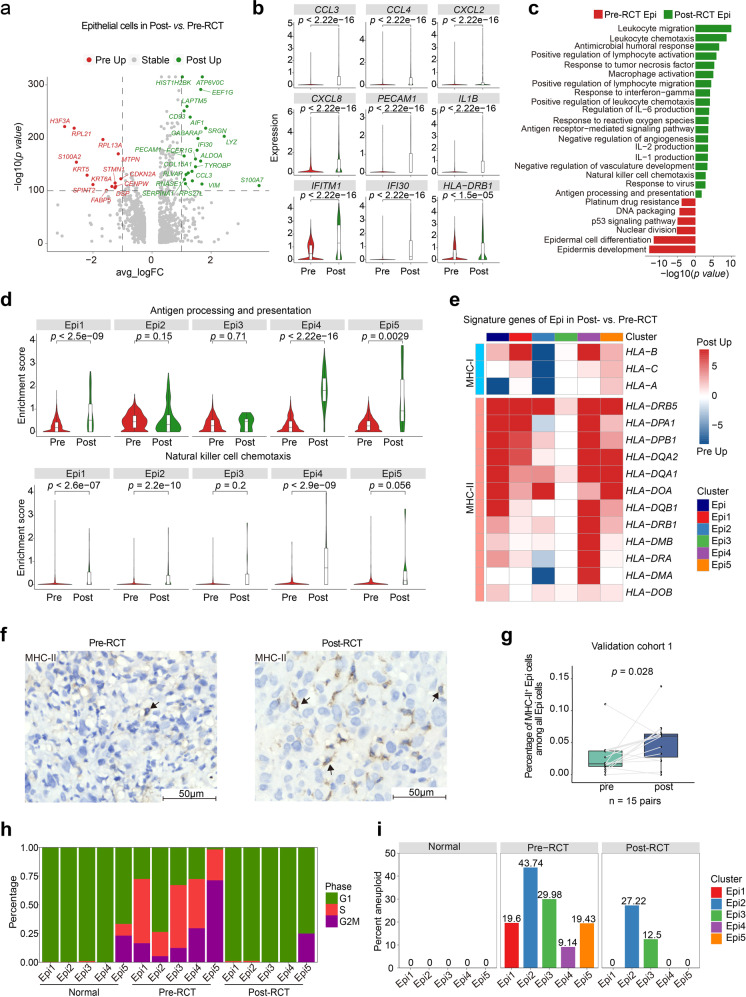
Fig. 2.
RCT activates the expression of immune response genes in epithelial cells. a Volcano plot showing the changes in gene expression in epithelial cells pre- and post-RCT. The colored dots represent the top most variable genes. b Violin plots showing the expression level of the indicated genes in epithelial cells pre- and post-RCT (two-sided Wilcoxon test). c The enriched GO terms for epithelial cells in pre- versus post-RCT samples. d Violin plots showing the indicated pathway enrichment of each Epi subcluster pre- and post-RCT (two-sided Wilcoxon test). e Heatmap showing the relative changes in MHC class I and II gene expression in all epithelial cells and each Epi subcluster in pre- and post-RCT groups. The intensity of the color indicates the extent of upregulation post-RCT (red) or pre-RCT (blue). f Representative images of IHC staining of MHC-II (HLA-DR + DP + DQ) in epithelial cells in paired pre-RCT and post-RCT FFPE tissues. Scale bar, 50 μm. g Box plot showing the fraction of MHC-II positive Epi cells among all Epi cells in pre-RCT and post-RCT samples based on IHC results in f. The p value corresponds to the paired t test. h Bar plots showing the proportion of cells in each cell cycle phase within each Epi subcluster normal, pre-RCT, and post-RCT samples. i Bar plots showing the percentage of aneuploid cells (tumor cells) within each Epi subcluster in normal, pre-RCT, and post-RCT samples

