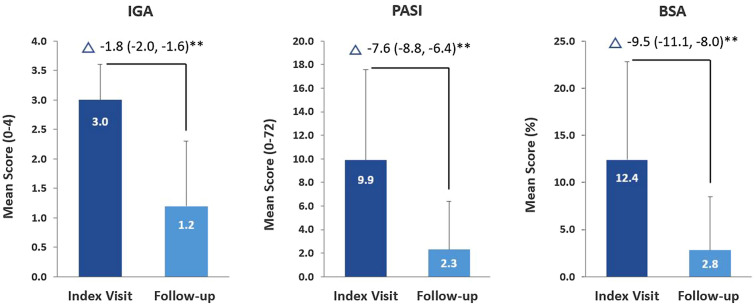
Fig. 3.
Mean changes in disease activity outcomes between index and follow-up visits after 9–12 months of persistent use of guselkumab. **P < 0.001. N = 130 for all outcomes. Vertical bars represent standard deviations. Δ indicates the mean change (95% CI) in values between the index and follow-up visits; improvements are indicated by negative values. P-values reflect the results of paired t-tests of the mean change in outcomes from zero (α = 0.05). BSA body surface area, CI confidence intervals, IGA Investigator’s Global Assessment, PASI Psoriasis Area Severity Index

