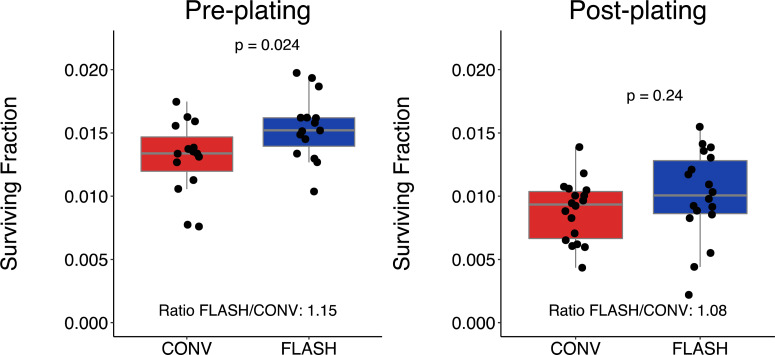
Fig. 2.
Clonogenic survival for the melanoma cell line MM576 after irradiation with 9 Gy of CONV (red, measured delivered doses 9.2–9.4 Gy) or FLASH (blue, measured delivered doses 9.4–9.6 Gy) using the pre-plating (left panel) or post-plating method (right panel). The box and whisker plots illustrate median (grey line), interquartile range (box), the lowest/highest observation within ± 1.5 × interquartile range from the box (whiskers), and individual flasks as black dots. Irradiation was performed using a modified clinical accelerator (Ref. 28) with beam characteristics and the experimental pre-plating protocol as previously described (Ref. 14). For the post-plating, 500 000 cells were plated in T12.5 flasks the day before irradiation, and 1 h after irradiation the cells were trypsinised, counted, re-plated in appropriate densities and then incubated and evaluated as the pre-plating flasks. Statistical comparisons were made in RStudio (version 1.2.5042) using the unpaired Student's T-test after testing for normality using the Shapiro-Wilk's test. ‘Ratio FLASH/CONV’ was calculated as the mean (Survival FractionFLASH) divided by the mean (Survival FractionCONV). Data from three independent experiments with triplicate-sextuplicate flasks per condition.

