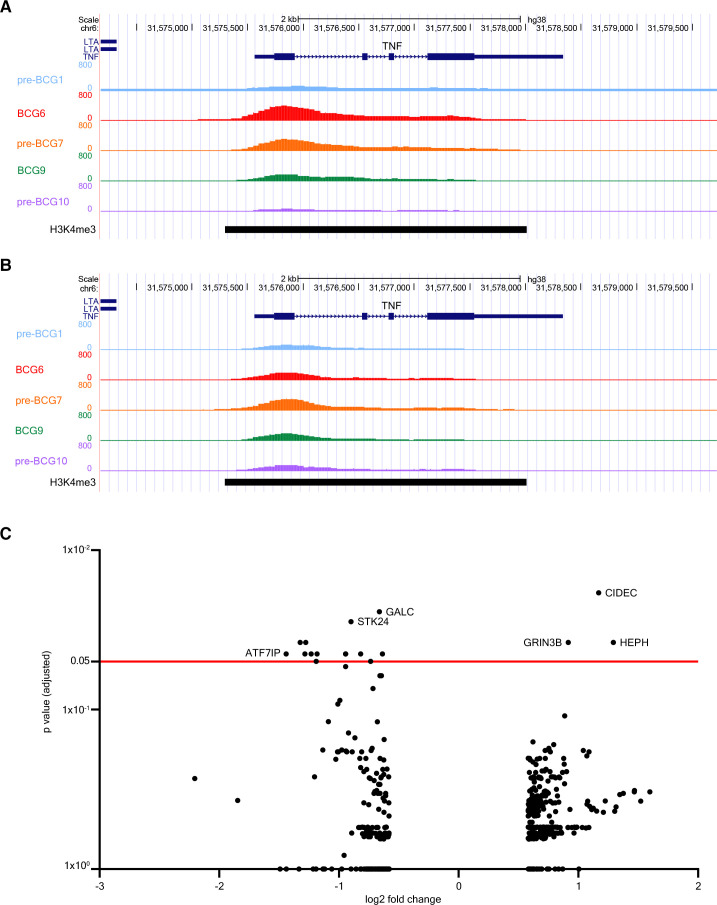
Figure 3.
BCG instillations induce epigenetic modifications in genes involved in autophagy, IL-1β, and epigenetic enzymes. Results of the ChIP-sequencing analysis. (A) UCSC genome browser tracks of H3K4me3 signal found around the TNF gene locus of a NMIBC patient with good clinical response to BCG. (B) H3K4me3 signal near the TNF gene locus of a patient who had a recurrence after BCG therapy. H3K4me3 signal is displayed for pre-BCG1, BCG6, pre-BCG7, BCG9 and pre-BCG10. (C) Volcano plot of ChIP-sequencing data. The x-axis displays the fold change (in log2) in H3K4me3 signal between pre-BCG1 and any of the post-BCG time points (BCG6, pre-BCG7, BCG9 and pre-BCG10; see online supplemental table 4). The y-axis displays the p value adjusted for multiple testing using the Benjamini-Hochberg method. The red line indicates an adjusted p value of 0.05. ChiP, chromatin immuno precipitation; NMIBC, non-muscle invasive bladder cancer; UCSC, University of California Santa Cruz.

