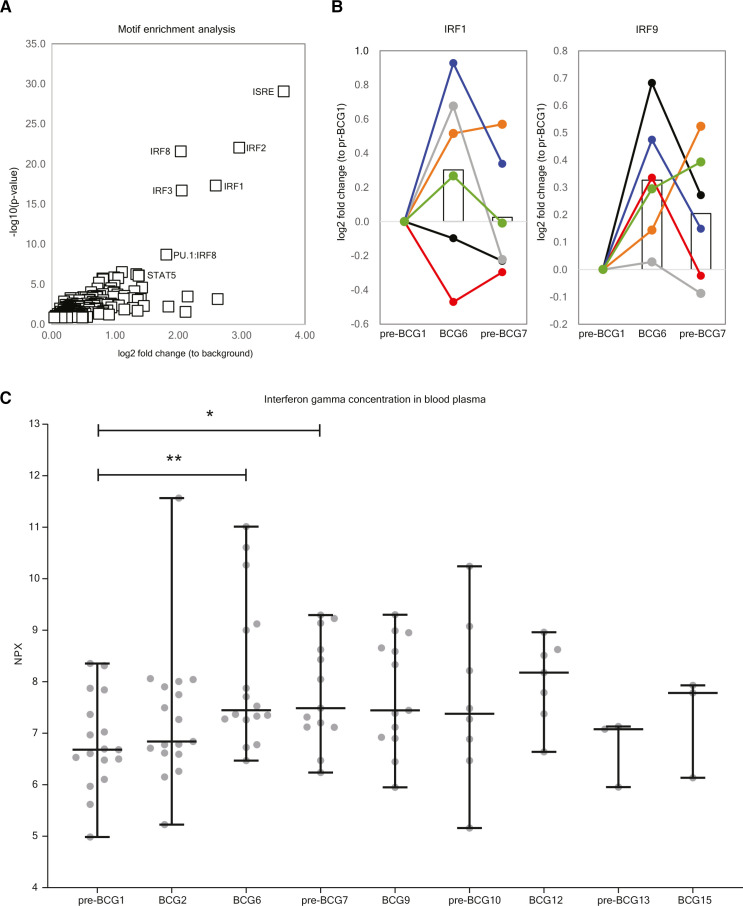
Figure 5.
Increased activity of IRF transcription factors and higher IFNγ plasma concentration may drive upregulation of genes after BCG instillations. (A) Motif enrichment analysis at the promoters of the upregulated genes between pre-BCG1 and BCG6 reveals that Interferon-Sensitive Response elements (ISRE) and IRFs are significantly more present at the promoter regions of upregulated genes. (B) Gene expression of IRF1 and IRF9 is increased at BCG6 (IRF1 p=0.0146, padjust=1; IRF9 p=0.0004, padjust=0.1763) (C) Concentration of IFNγ in blood plasma of Tribute patients at each time-point. Data are presented in NPX values, which is a log2 scale. Individual patient values are displayed as gray dots. Group values are displayed as median±range. Two tailed matched-pair Wilcoxon signed-rank test was used to determine statistical significance between time points. Statistical significance was accepted at p<0.05 and indicated as follows: *p<0.05, **p<0.01, ***p≤0.001, ****p≤0.0001. Number of data points per time point: pre-BCG1: 17, BCG2: 17, BCG6: 16, pre-BCG7: 14, BCG9: 13, pre-BCG10: 8, BCG12: 7, pre-BCG13: 3, BCG15: 3. IRFs, Interferon Regulatory Factors.

