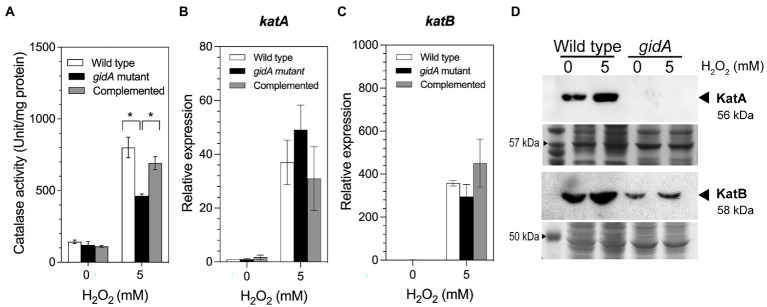
Figure 2.
Impact of gidA disruption on catalase gene expression. (A) The catalase-specific activity of the wild-type, gidA inactivation mutant, and complemented strains. (B) Relative mRNA expression levels of katA, and (C) katB, in the wild-type, gidA mutant, and complemented strains upon H2O2 exposure. The wild-type and gidA mutant carried the pBBR1MCS-4 plasmid as a vector control. The data represent the mean ± SD values of three biological replicates for (A–C). The statistical analysis was performed using Graphpad Prism (GraphPad Software). Asterisks denote a significant difference in the one-way ANOVA (* p ≤ 0.05). (D) Western blot analysis of the KatA and KatB proteins. Anti-KatA antibody was used to assess KatA level. The amounts of KatA and KatB proteins overexpressed from the pBB-katA-6xHis plasmid and pBB-katB-6xHis plasmids, respectively, were assessed using the anti-His antibody. The amount of total protein loaded in each gel is shown as the loading control. The data shown are representative results of three biological replicates.

