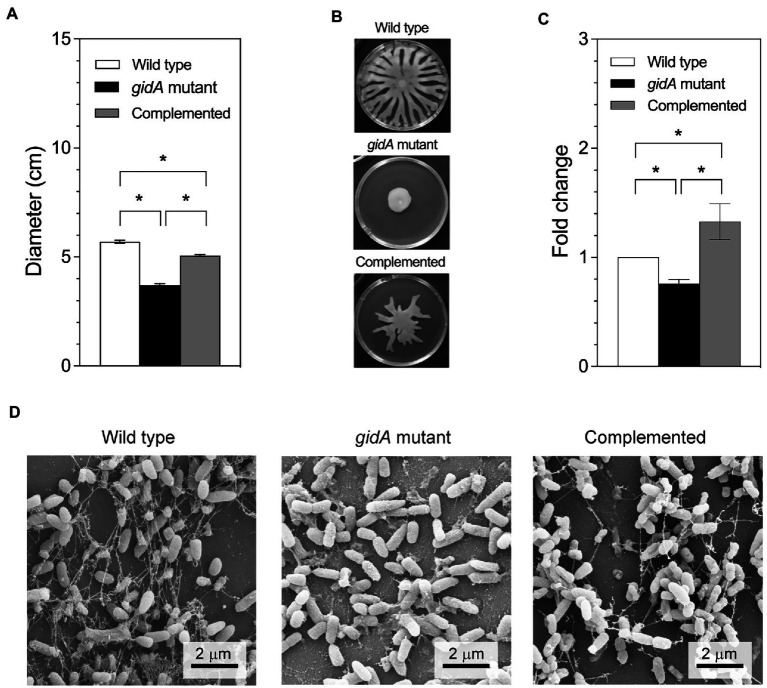
Figure 3.
The gidA mutant strain shows defects in motility and biofilm production. (A) Swim colony diameter. Bacteria were stabbed into 0.3% BM2 medium agar. After incubation, the diameter of bacterial migration was measured from the stab point. (B) Images of the swarming plates. (C) The fold change in biofilm production for the wild-type, gidA mutant, and complemented strains using dye staining method. (D) Scanning electron microscope showing the biofilm formation. The images were recorded at magnification of 15,000x. The wild type and gidA mutant carried the pBBR1MCS-4 plasmid as a vector control. The data represent the mean ± SD values of three biological replicates for (A,C). The statistical analysis was performed using Graphpad Prism (GraphPad Software). Asterisks denote a significant difference in the one-way ANOVA (* p ≤ 0.05).

