. 2023 Jan 10;27(1):24–29. doi: 10.7874/jao.2022.00227
Copyright © 2023 The Korean Audiological Society and Korean Otological Society
This is an Open Access article distributed under the terms of the Creative Commons Attribution Non-Commercial License (http://creativecommons.org/licenses/by-nc/4.0/) which permits unrestricted non-commercial use, distribution, and reproduction in any medium, provided the original work is properly cited.
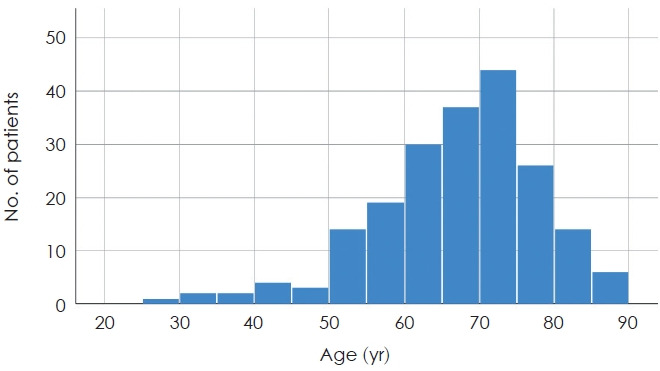
Fig. 1.

Age distribution of study population (n=202).
