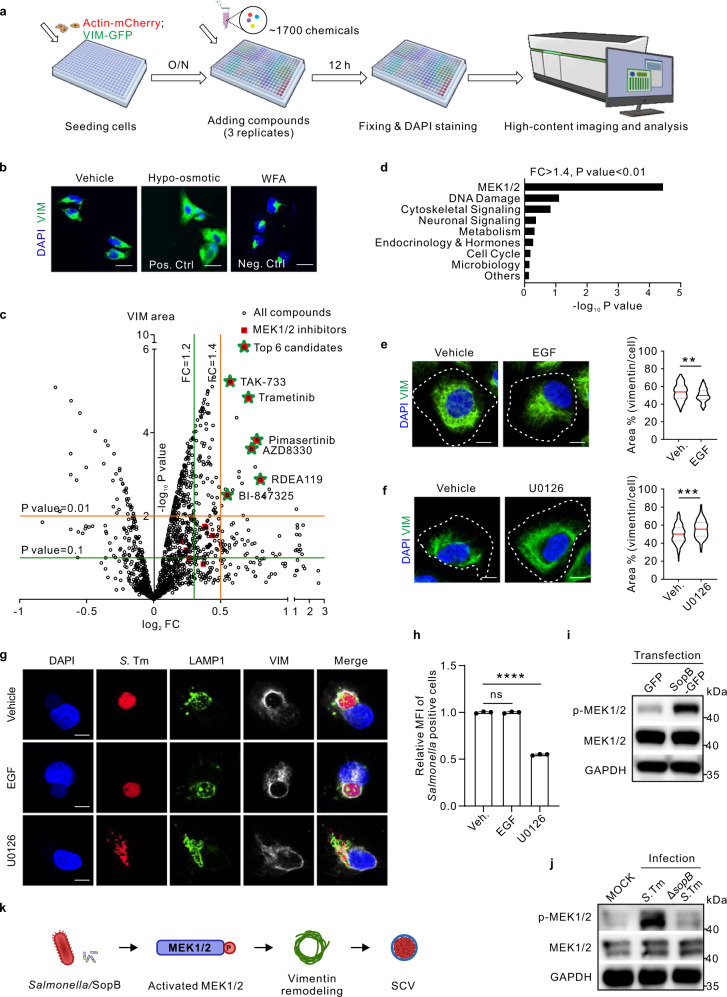
Fig. 4. An imaging-based screen identifies MEK1/2 pathway to control vimentin rearrangement and subsequent intracellular replication of Salmonella.
a Schematic diagram of the imaging-based high-content drug screen. b Immunofluorescence images of vimentin in cells treated with hypo-osmotic shock (as a positive control) and WFA (as a negative control), respectively. c Volcano plot revealed candidates inducing vimentin rearrangement from the screen. Red squares represent candidates belonging to MEK1/2 inhibitors. Green stars represent the top six candidates belonging to MEK1/2 inhibitors to disperse vimentin (FC > 1.4, P-value < 0.01). d Enrichment of signaling pathways of the top candidates (FC > 1.4, P-value < 0.01) from the screen. e,f, Immunofluorescence images of cells treated with the commercial activator EGF (e) and inhibitor U0126 (f) of MEK1/2 for 24 h, respectively. Quantification of the relative vimentin area versus cell area is shown in the right panel. n = 20 views (60×/1.5 oil objective) from three independent experiments. g Immunofluorescence images of cells infected with Salmonella (MOI = 10) at 24 hpi, treated with EGF and U0126 for 24 h, respectively. h Quantification of relative MFI values by FACS in cells infected with mCherry-tagged Salmonella (MOI = 50) at 24 hpi, treated with EGF and U0126, respectively, from three independent experiments. i Western blotting analysis to detect the phosphorylation level of MEK1/2 upon sopB-GFP transfection. j Western blotting analysis to detect the phosphorylation level of MEK1/2 upon Salmonella or ΔsopB Salmonella infection (MOI = 10) at 24 hpi. GAPDH serves as the loading control (i, j). k Schematic diagram of activated MEK1/2 by Salmonella/SopB induced vimentin remodeling to surround SCV. White dash lines in (e and f) indicate the outline of the cells. Assays were conducted three times independently with similar results (b, i and j). Scale bars, 10 μm (e, f and g) and 20 μm (b). Data are represented as mean ± SD. Statistics (ns, p > 0.05; **p < 0.01; ***p < 0.001; ****p < 0.0001): unpaired two-tailed Student’s t-test (c, right panel of e and f), EASE score (d) or one-way ANOVA with Dunnett’s analysis (h). Source data are provided as a Source Data file.

