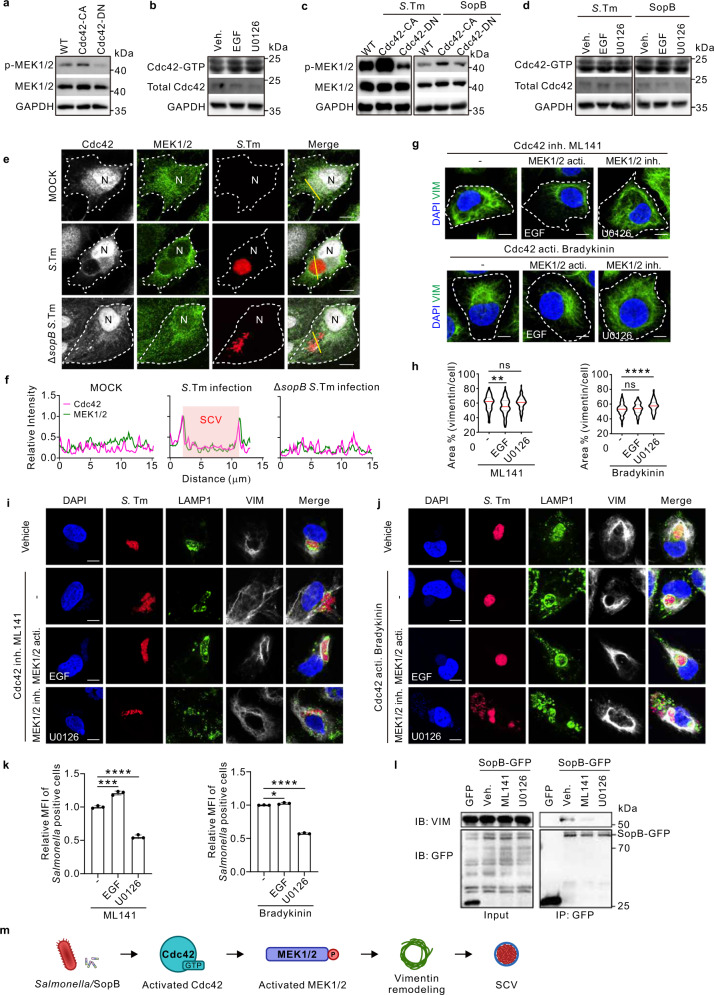
Fig. 5. Cdc42 enhances MEK1/2 to regulate vimentin-mediated intracellular replication of Salmonella.
a Western blotting analysis to detect p-MEK1/2 level in WT, constitutively-active (CA) or dominant-negative (DN) Cdc42 expressed cells. b Western blotting analysis to detect the active Cdc42 level in control, EGF and U0126 treated cells. c Western blotting analysis to detect p-MEK1/2 level in WT, Cdc42-CA, and Cdc42-DN expressed cells upon Salmonella infection (MOI = 20) or sopB-GFP transfection. d Western blotting analysis to detect the active Cdc42 level in control, EGF and U0126 treated cells upon Salmonella infection or sopB-GFP transfection. GAPDH serves as the loading control (a−d). e Immunofluorescence images of cells infected with Salmonella and ΔsopB Salmonella (MOI = 10) at 24 hpi. N indicated the nuclear position. f Relative fluorescence intensity profile of Cdc42 and MEK1/2 signaling based on the yellow line in (e). Pink square indicated the position of SCV. g Immunofluorescence images of cells treated with EGF or U0126, in the context of Cdc42 inhibition or activation, respectively. h Quantification of the relative vimentin area in (g) was measured. n = 20 views (60×/1.5 oil objective) from three independent experiments. i, j Immunofluorescence images of cells upon Salmonella infection (MOI = 10) at 24 hpi, treated with ML141 (i) or Bradykinin (j) in the context of MEK1/2 activation or inhibition, respectively. k Quantification of relative MFI values by FACS in cells upon Salmonella infection (MOI = 50) at 24 hpi, treated with the corresponding chemicals in (i, left panel) and (j, right panel), from three independent experiments. l Co-IP assay followed by Western blotting to test for association of SopB-GFP with vimentin upon Cdc42 or MEK1/2 inhibitor treatment. m Schematic diagram of Salmonella/SopB-Cdc42-MEK1/2 axis induced vimentin remodeling to surround SCV. White dash lines in (e and g) indicate the outline of cells. Assays were conducted three times independently with similar results (a–e and i). Scale bars, 10 μm (e, g, i and j). Data are represented as mean ± SD. Statistics (ns, p > 0.05; *p < 0.05; **p < 0.01; ***p < 0.001; ****p < 0.0001): one-way ANOVA with Dunnett’s analysis (h, k). Source data are provided as a Source Data file.

