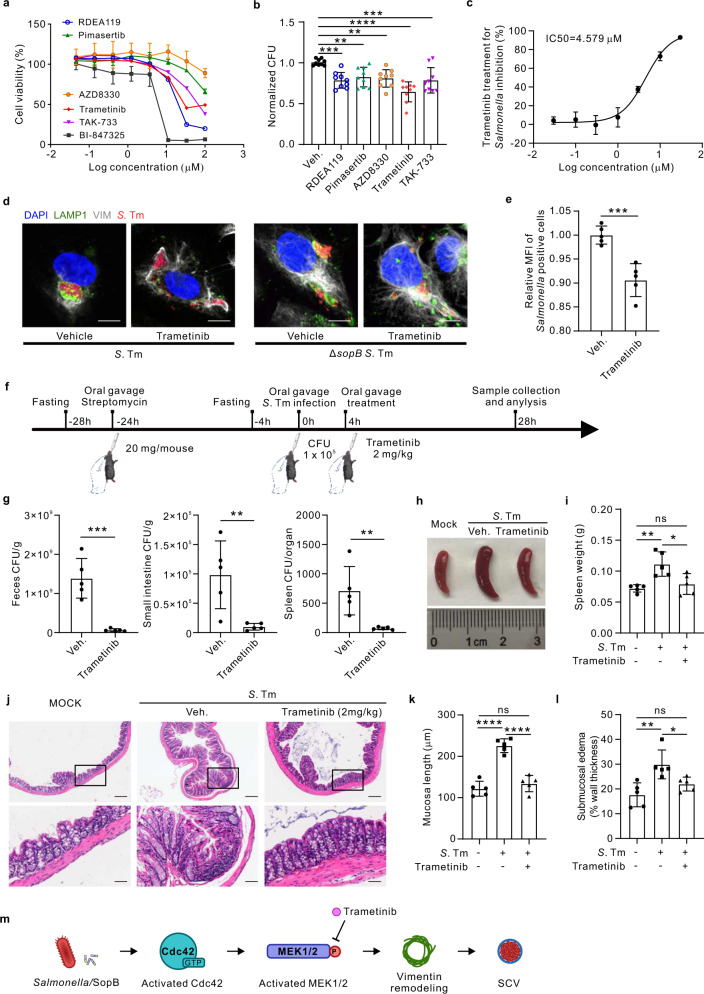
Fig. 6. MEK1/2 inhibitors including the clinically-approved Trametinib show anti-infection effects of Salmonella in both cell and mouse model.
a Quantification of the cell viability treated with the top six MEK1/2 inhibitors identified in the screen, from three independent experiments. b Quantification of the total intracellular bacterial colony forming unit (CFU) in cells infected with Salmonella (MOI = 10) and treated with five MEK1/2 inhibitors (1 µM) that showed no cytotoxic effects, at 24 hpi from three independent experiments. c Quantification of the Salmonella inhibition rate (MOI = 10) at 24 hpi with increasing concentrations of Trametinib. IC50 was calculated using nonlinear regression analysis from three independent experiments. d Immunofluorescence images of cells infected with Salmonella and ΔsopB Salmonella (MOI = 10) at 24 hpi, treated with Trametinib. Scale bars, 10 μm. e Quantification of relative MFI values by FACS in Salmonella infection cells treated with Trametinib at 24 hpi, from three independent experiments. f Schematic diagram of the oral gavage infections of Salmonella in mice enterocolitis model. g Bacterial loads in feces (left panel), small intestine (middle panel), and spleen (right panel) from Salmonella infected mice treated with or without Trametinib for 24 h. h Representative spleen of the mouse from each group was taken for photographic documentation. i Quantification of the total weight of spleen from uninfected and infected mice treated with or without Trametinib, respectively. j Representative images of H&E-stained colon sections illustrate pathological conditions of the mice. Scale bars, 100 μm in the upper images and 25 μm in the magnified images. k, l Quantification of the mucosal length (k) and submucosal edema (l) from uninfected and infected mice treated with or without Trametinib, respectively. m Schematic diagram of Salmonella/SopB-Cdc42-MEK1/2 axis induced vimentin remodeling to surround SCV, which was inhibited by MEK1/2 inhibitor Trametinib treatment. Data are represented as mean ± SD. n = 5 mice in (g, i and k, l). Statistics (ns, p > 0.05; *p < 0.05; **p < 0.01; ***p < 0.001; ****p < 0.0001): unpaired two-tailed Student’s t-test (e, g) or one-way ANOVA with Dunnett’s analysis (b, i, k and l). Source data are provided as a Source Data file.

