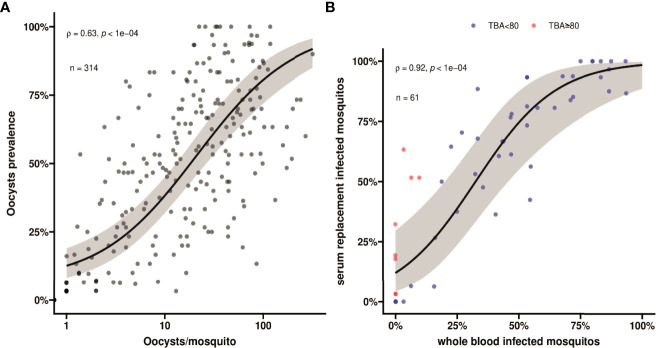
Figure 2.
(A) A scatter plot showing association between oocyst prevalence, or mosquito infection rates, and mean oocyst per mosquito. Spearman’s ρ =0.63 indicating a moderate positive monotonic association p<0.0001. The black line shows the fit from a logistic regression model and the grey shading shows the 95% confidence interval. (B) A scatter plot indicating the association in mosquito infection rates between whole blood and serum replacement feeds. Observations with TBA<80% are indicated in blue and TBA≥80% are indicated in red. Spearman’s ρ = 0.92 indicates a strong positive monotonic association (p<0.0001). The black line shows the fit from a logistic regression model and the grey shading shows the 95% confidence interval. The plot also indicates that infectivity in the serum replacement condition (median 60.6%, IQR 6.3% - 85.2%) was consistently higher than in the whole blood condition (median 33.3%; IQR 0% - 57.6%) (p<0.0001). This value is different, but not contradicting, the comparison in the main text where we calculated the pairwise differences and report the median and IQR for the pairwise differences.

