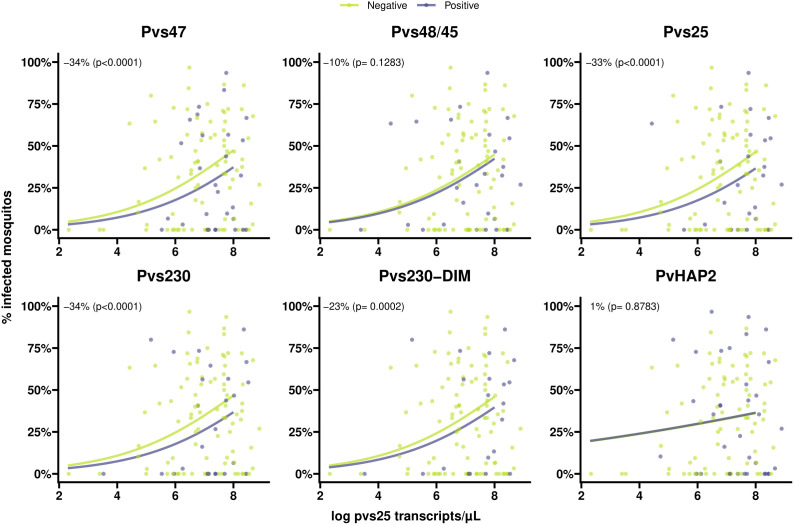
Figure 5.
Scatter plots indicating the association between gametocyte density and antibody prevalence on mosquito infectivity for six different antigens. Positive antibodies are indicated in light blue and negative antibodies are indicated in green. The light blue and green lines shows the fit from logistic regression models for the association between gametocyte density and mosquito infectivity for positive and negative antibodies respectively. The numbers in the plot (estimated from logistic regression models) indicate the average difference in mosquito infectivity between positive and negative antibodies while accounting for gametocyte density, and the p-values indicate whether or not these differences are significantly different from 0%.

