Figure 1.
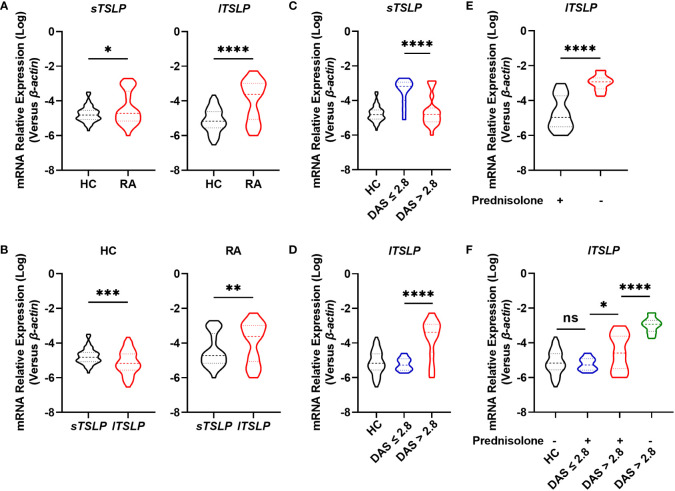
Comparison of mRNA levels of TSLP isoforms between RA patients and HC. (A) RT-qPCR analysis of the mRNA expression of sTSLP and lTSLP in PBMCs from RA patients (n = 68) versus HC (n = 66). (B) RT-qPCR comparison of sTSLP and lTSLP mRNA expression in PBMCs from HC and RA patients. (C, D) RT-qPCR analysis of sTSLP and lTSLP mRNA levels in active and inactive RA patients was compared to HC. (E) RT-qPCR analysis of the mRNA expression of lTSLP in RA patients with or without prednisolone treatment. (F) RT-qPCR analysis of lTSLP mRNA expression in HC and in active and inactive RA patients following prednisolone treatment. Data are depicted as a violin plot. (A-F) were analyzed by unpaired two-tailed Student’s t-test. *P < 0.05, **P < 0.01, ***P < 0.001, and ****P < 0.0001. ns, no significant.

