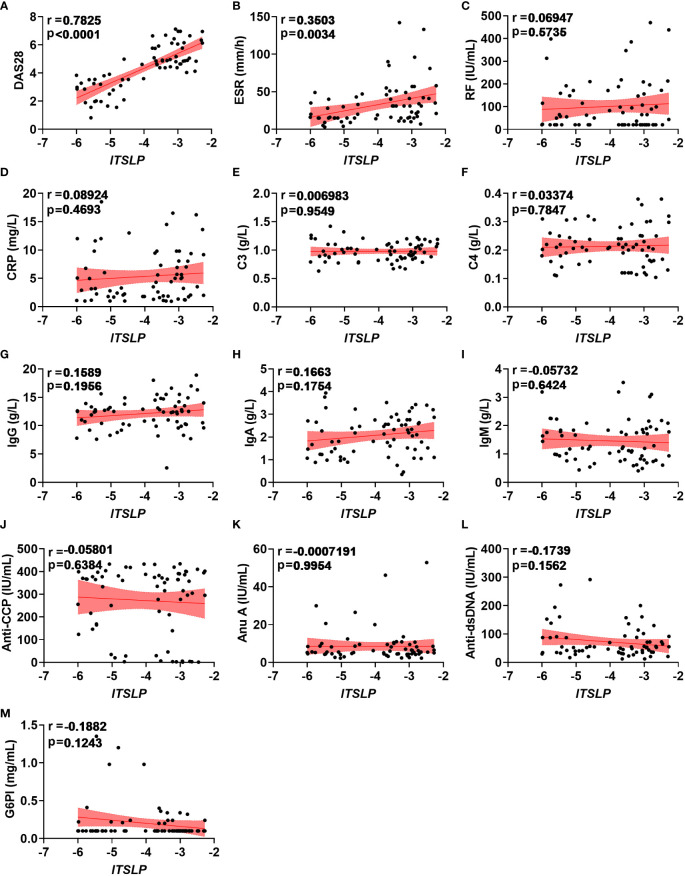
Figure 2.
Correlations between lTSLP expression and RA clinical values. (A-M) The relationship analysis of lTSLP mRNA expression with laboratory values, including DAS28 (A), ESR (B), RF (C), CRP (D), C3 (E), C4 (F), IgG (G), IgA (H), IgM (I), Anti-CCP (J), Anu A (K), Anti-dsDNA (L), and G6PI (M). The correlation was determined using Spearman’s non-parametric test. Each symbol represents an individual RA patient.

