Figure 1.
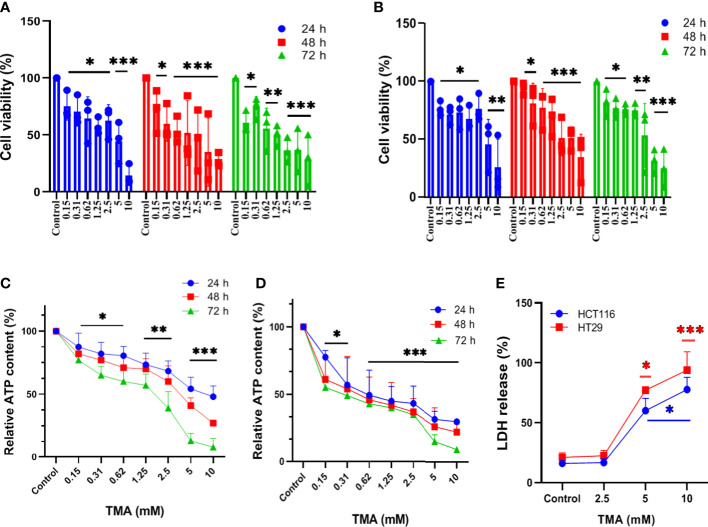
Assessment of cell viability of HCT116 and HT29 exposed with different concentration of TMA. Cytotoxicity of TMA was evaluated by MTT assay (A. HCT116, (B) HT29), luminescent assay (C. HCT116, D) HT29) and LDH assay (E). Cells were treated with or without different concentrations of TMA for 24 h, 48 h and 72 h. Cellular viability (A, B) and membrane integrity (E) were analyzed colorimetrically following treatment with TMA. Below 5 mM TMA exposure, there is no significant increase in LDH release compared to control group. Luminescence was measured for measuring ATP level (C, D). Untreated control is considered as 100%. Difference of average values between untreated and treated cells were tested using one way ANOVA. All tested subjects showed significant decrease in viability at higher concentration of TMA while 10 mM TMA at 72 h proved most cytotoxic to cells. Significance was calculated in comparision to control. The results (mean±SEM) were obtained from 3 independent experiments. Error bars represent standard error from three independent experiments. *indicates significantly different values compared to control group (P<0.05)** indicates significantly different values compared to control group (P<0.001). ***indicates significantly different values compared to control group (P<0.0001).

