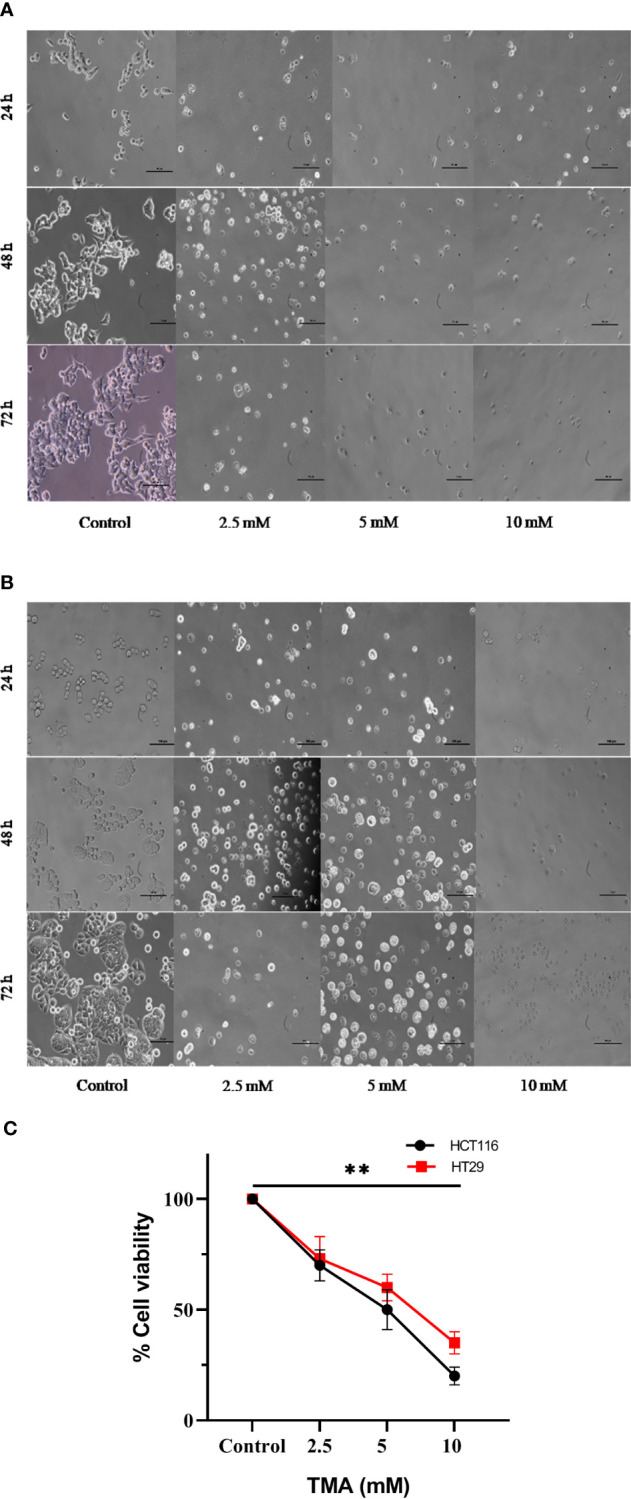
Figure 3.

Bright field images of HCT116 (A) and HT29 (B) showing changes in cellular morphology, detachment from surface, decreased no. with increase in TMA concentration and time of exposure. Decrease in cell viability was observed after exposure (C). ** indicates significant decrease in cell viability compared to control group (P<0.001).
