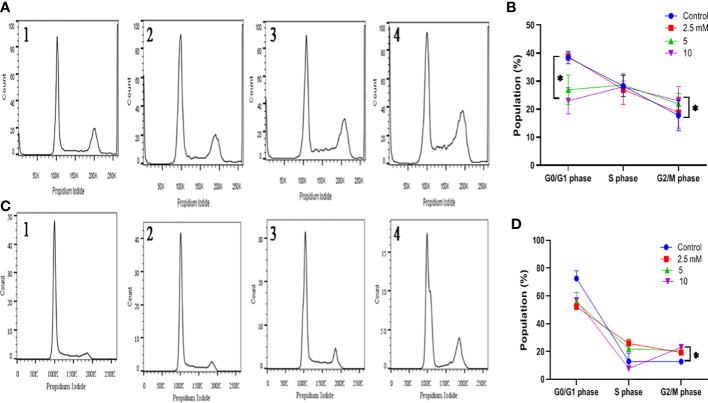
Figure 6.
Effect of TMA on cell cycle progression. Evaluation of cell cycle HCT116 (A) and HT29 (B) cells were treated with various concentrations of TMA for 48 h. Untreated cells were considered as negative control. (A) and (B) showed the quantification of cell cycle distribution. TMA induced cell cycle arrest. 1, 2, 3, and 4 represent control, 1.25 mM, 5 mM and 10 mM treatment respectively. The distribution of various phase of HCT116 and HT29 cells are represented in (C, D) Difference of average values between untreated and treated cells were tested using one-way ANOVA. The results (mean±SEM) were obtained from 3 independent experiments. *indicates significantly different values compared to control group (P<0.05).

