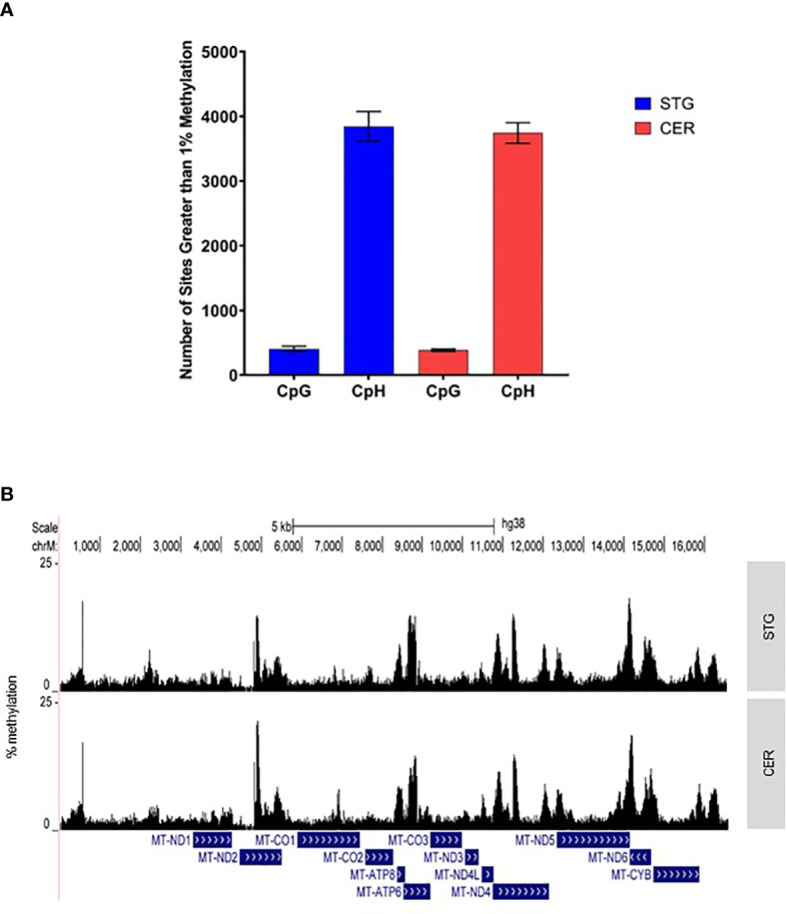
Figure 1.

The mitochondrial genome is characterized by specific regions of methylation, predominantly in a CpH context. (A) Shown is the mean number of sites with >1% methylation in the STG (blue) and CER (red) in either a CpG or CpH context. Error bars represent the standard error of the mean (SEM). (B) Graph showing mean % methylation at each cytosine in the mitochondrial genome in STG (top panel) and CER (bottom panel) samples, created using UCSC browser (http://genome.ucsc.edu).
