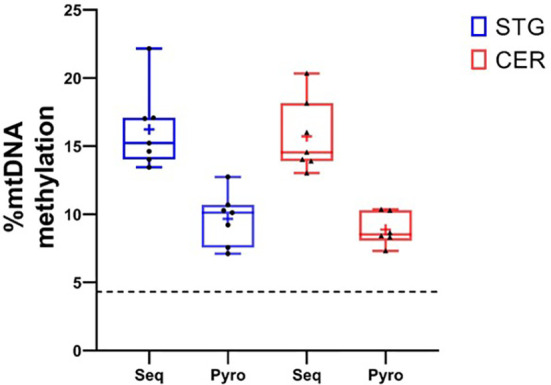
Figure 2.

Validation of mtDNA methylation in the D-Loop using pyrosequencing. Box plots showing % methylation levels at site ChrM:545 in the seven donors used in the study, when profiled using targeted bisulfite sequencing (Seq) and pyrosequencing (Pyro) in the STG (blue) and CER (red). Boxplots represent the median (central line) and interquartile range (perimeter), with plus sign denoting the mean, whiskers showing the minimum and maximum value, and individual datapoints shown as black circles (STG) or triangles (CER). The dashed black horizontal line represents the reported minimum threshold for detecting methylation using pyrosequencing (4.3%).
