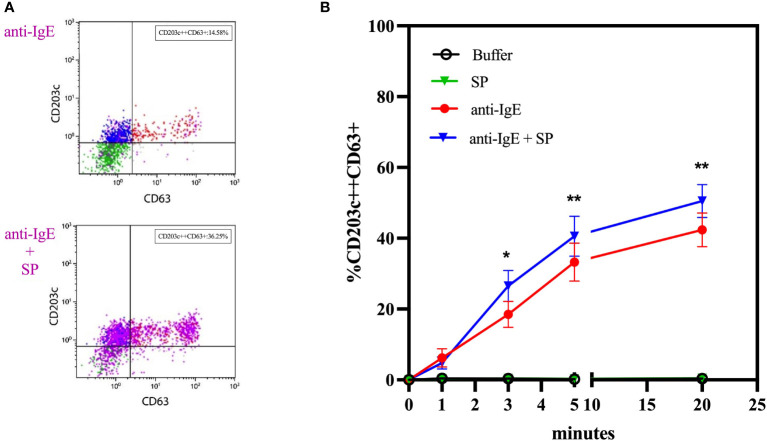
Figure 4.
Co-incubation experiments with anti-IgE and substance P. (A) Representative plots of the effect of co-incubation of anti-IgE and SP on the membrane expression of CD63 of whole blood basophils in comparison to anti-IgE alone. (B) Time kinetics of the effect of SP, anti-IgE and SP in co-incubation with anti-IgE on the membrane expression of CD63 of whole blood basophils (n=10). SP = substance P. * p ≤ 0.05; ** p ≤ 0.01 anti-IgE compared to anti-IgE + SP at each time point; paired Student’s t-tests.

