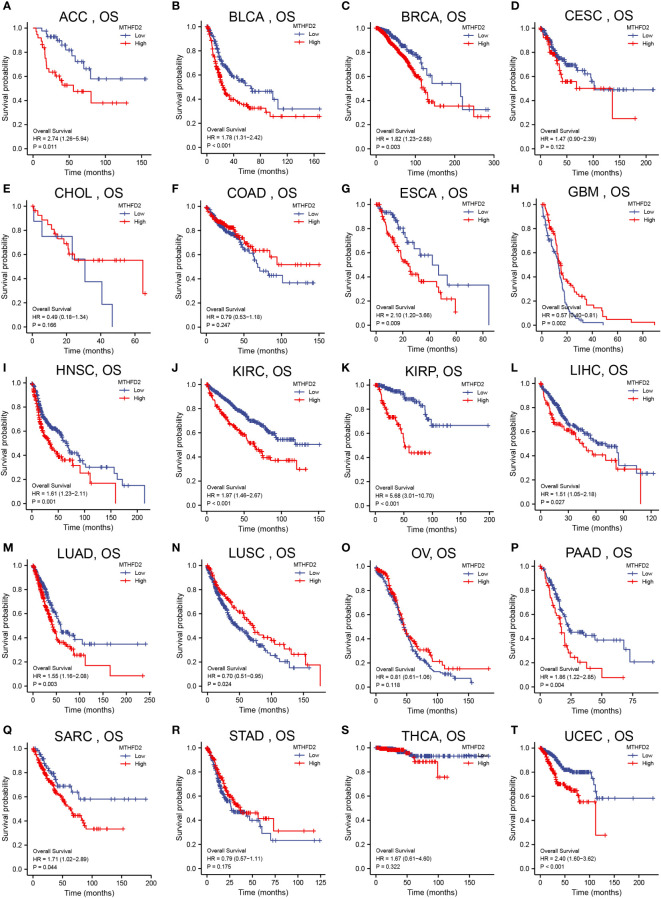
Figure 2.
Pan-cancer patient survival analysis. Overall survival (OS) analysis of MTHFD2 in different tumors using Kaplan–Meier survival curves. (A) ACC, (B) BLCA, (C) BRCA, (D) CESC, (E) CHOL, (F) COAD, (G) ESCA, (H) GBM, (I) HNSC, (J) KIRC, (K) KIRP, (L) LIHC, (M) LUAD, (N) LUSC, (O) OV, (P) PAAD, (Q) SARC, (R) STAD, (S) THCA, (T) UCEC. Red lines indicate high MTHFD2 expression, while blue lines indicate low MTHFD2 expression.

