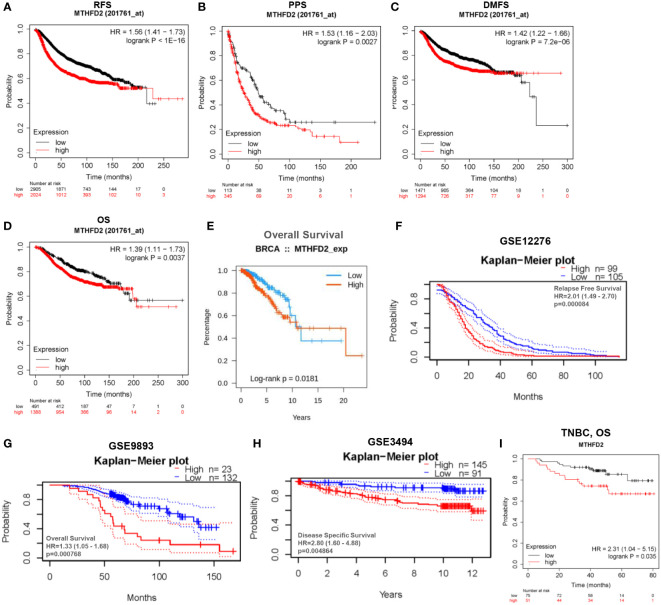
Figure 5.
Analysis of patient prognosis in breast cancer. (A–H) Relationship between MTHFD2 expression and prognosis in breast cancer patients. (A–D) Kaplan-Meier curves were constructed based on the Kaplan-Meier Plotter database. (A) RFS, recurrence-free survival; (B) PPS, post-progression survival; (C) DMFS, distant metastasis-free survival; (D) OS, overall survival. (E) Survival curves for patients with breast cancer based on data obtained from the TISIDB database. (F–H) Kaplan-Meier curves were drawn based on the GEO database with data obtained from the PrognoScan database. (F) GSE12276, relapse free survival; (G) GSE9893, overall survival; (H) GSE3494, disease specific survival. (I) Kaplan-Meier curve drawn based on the Kaplan–Meier Plotter database for predicting overall survival in TNBC patients.

