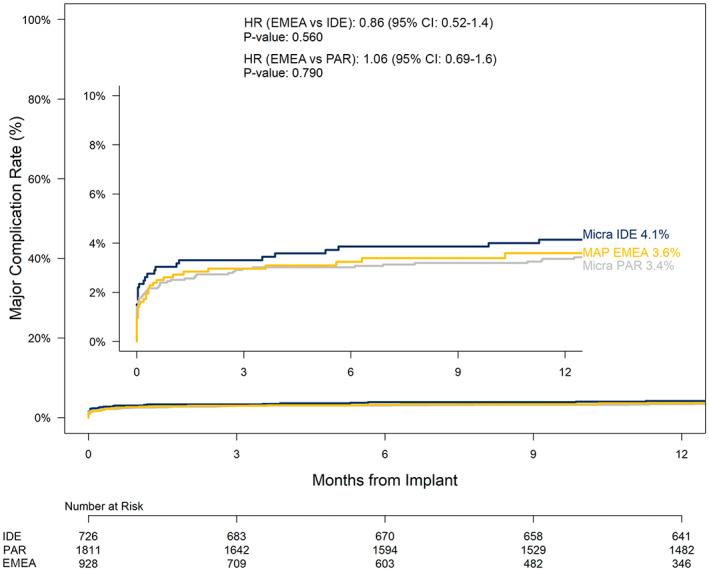
FIGURE 2.

Major complication rates through 12 months for MAP EMEA, Micra IDE, and Micra PAR study cohorts. Kaplan–Meier analysis of major complications over 12 months. Fine‐gray competing risks were used to compare major complication rates. EMEA, Europe, Middle East, and Africa; IDE, investigational device exemption; PAR, post‐approval registry
