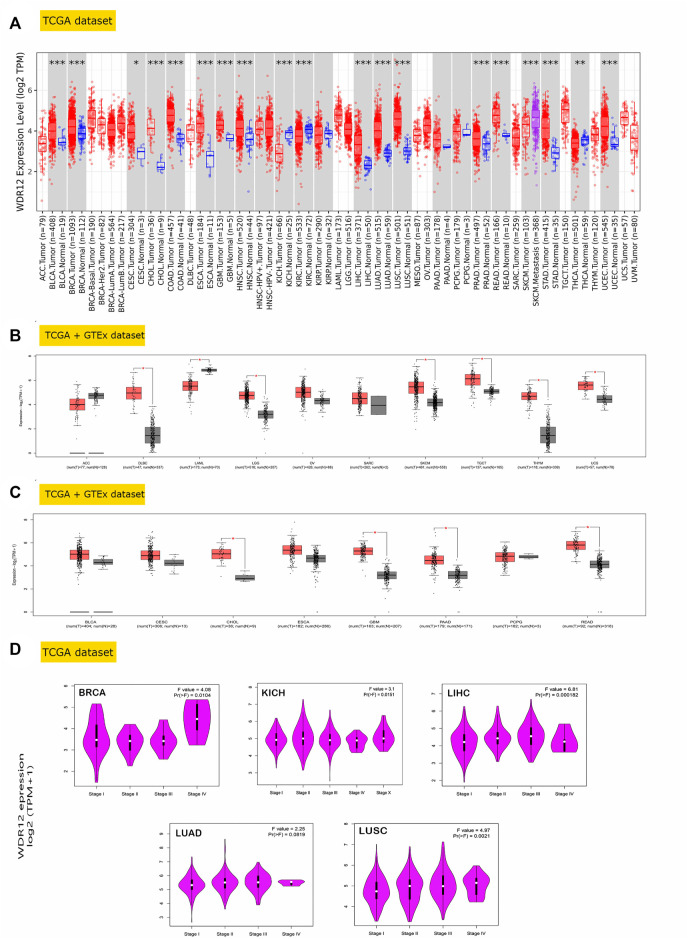
FIGURE 1.
WDR12 expression assessment in human cancers. (A) Differential expression of WDR12 in a panel of TCGA tumors analyzed by TIMER2.0; (B) tumors that lack normal tissue for comparison in TIMER2.0. Database and experienced a trend of elevated WDR12 expression in tumor versus normal tissue when analyzed in the GEPIA database; (C) tumors that underwent a significant WDR12 protein expression versus normal tissue; (D) tumors experienced a positive correlation between WDR12 expression and the tumor stage.

