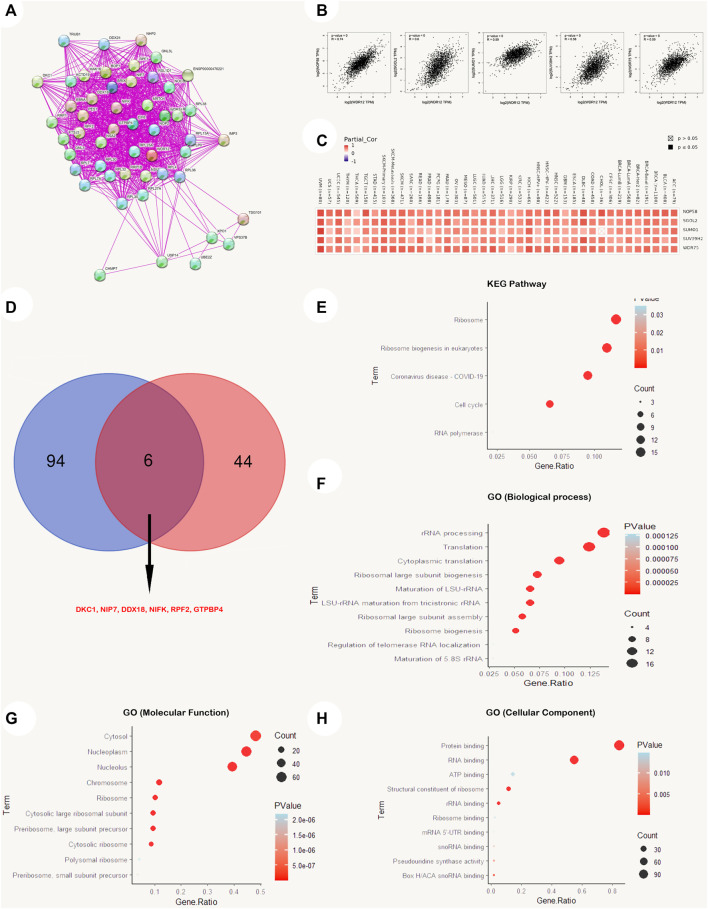
FIGURE 9.
WDR12-protein network interactions. (A) A map of top 50 WDR12 interacting proteins as determined by STRING database; (B) expression correlation between WDR12 and genes (NOP58, SGOL2, SUMO1, SUV39H2 and WDR75) as determined by GEPIA2; (C) heatmap for top 5 WDR12-correlated proteins in the tumor tissue; (D) Venn diagram showing the intersection between WDR12 interacting and correlating proteins; (E–H) KEGG/GO enrichment analysis based on WDR12-binding and interacted genes.

