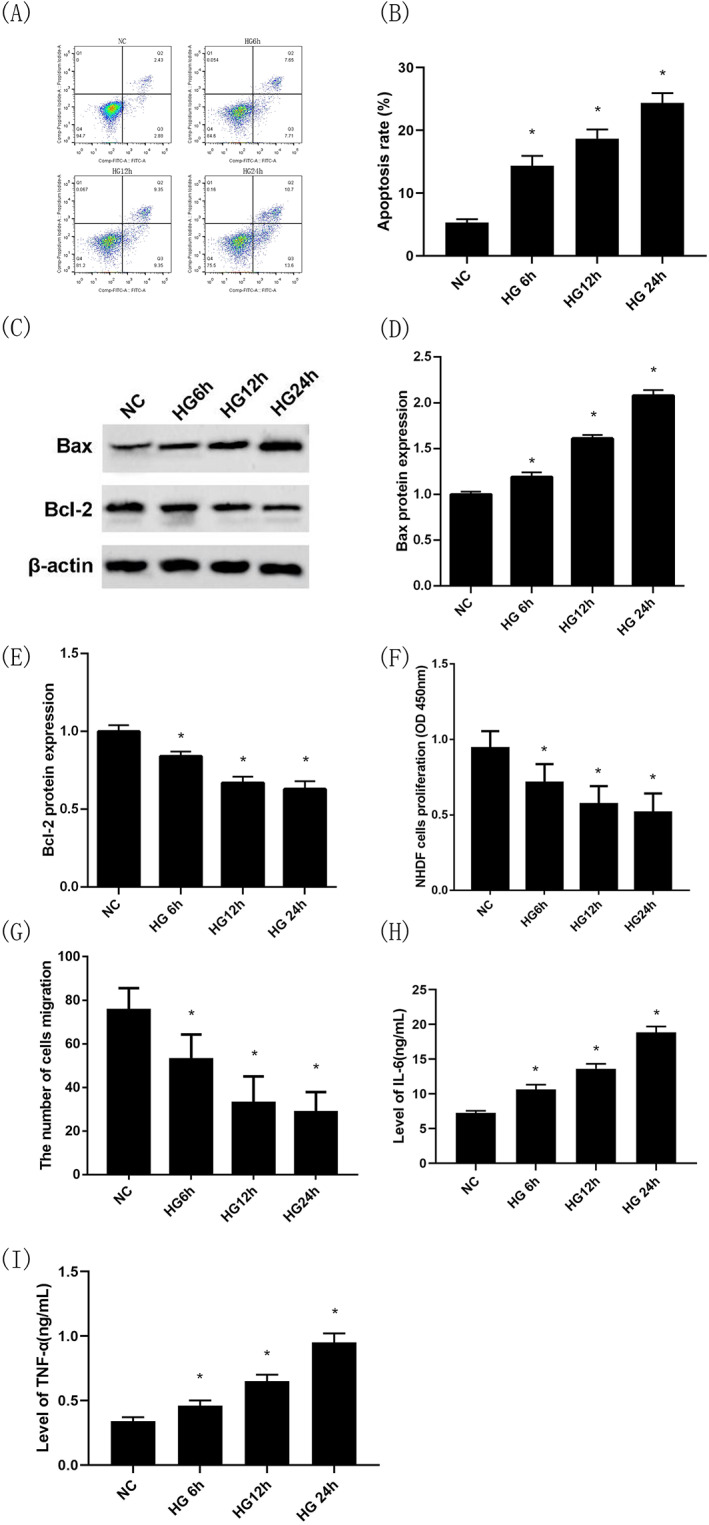
FIGURE 2.

Changes in the proliferation, migration, and apoptosis of NHDFs and secretion of inflammatory cytokines by NHDFs under high‐glucose treatment at different time points. Apoptosis of NHDFs under high‐glucose intervention at different time points by flow cytometry (Annexin V‐PI) (A),(B); Bax protein expression under high‐glucose intervention at different time points by Western blotting (C),(D); Bcl‐2 protein expression under high‐glucose intervention at different time points by Western blotting (C),(E); Proliferation capacity of NHDFs under high‐glucose intervention at different time points by CCK‐8 (F); The number of cells migration of NHDFs under high‐glucose intervention at different time points by transwell migration assay (G); IL‐6 levels in cell culture medium under high‐glucose intervention at different time points by ELISA (H); TNF‐α levels in cell culture medium under high‐glucose intervention at different time points by ELISA (I); *P < 0.05 vs the NG group; n = 3 in each group. NG, normal glucose; HG, high glucose; NHDFs, human dermal fibroblasts
