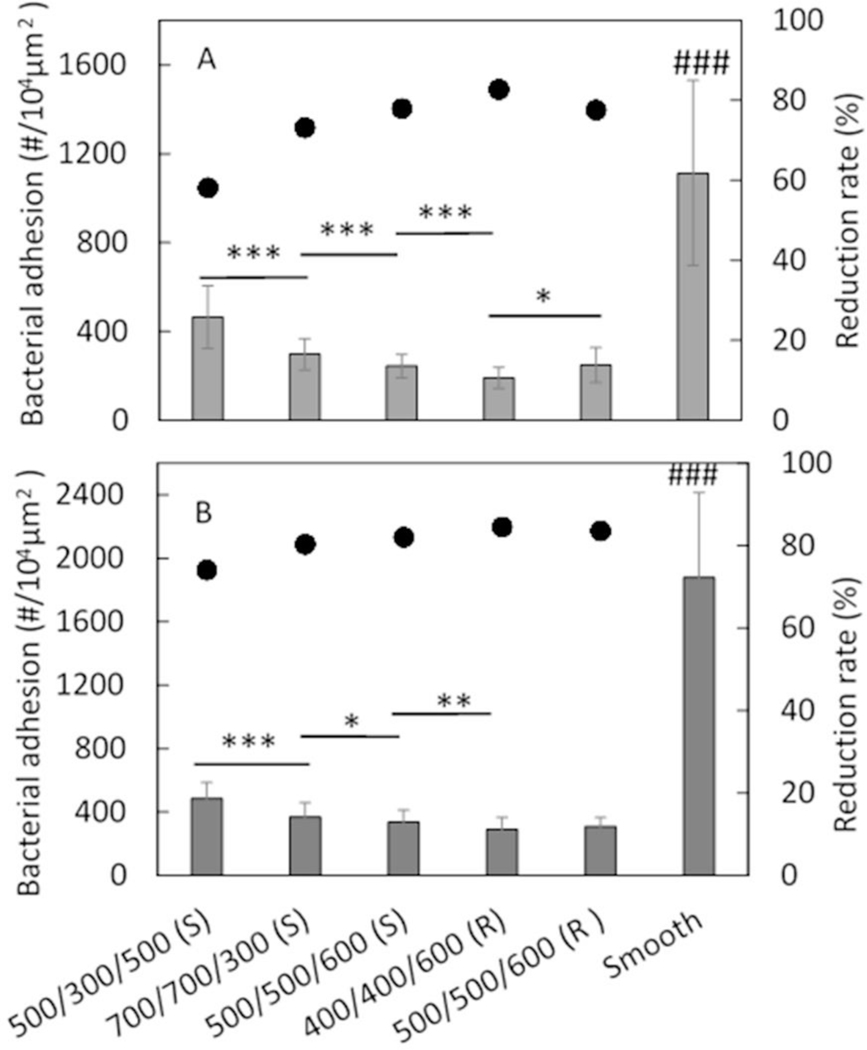
Figure 5.
Bacterial adhesion on textured surfaces in PBS for 1 h with (A) S. epidermidis RP62A, and (B) S. aureus Newman D2C (S=square, R=round). (*: p<0.05; **: p<0.01; ***: p<0.001, ###: p<0.001 comparing to all textured surfaces.) Data is shown as mean ± standard deviation for n=3 samples. Bar and left axis show the bacterial adhesion, and dots and the right axis show the reduction rate compared to smooth PUU control.

