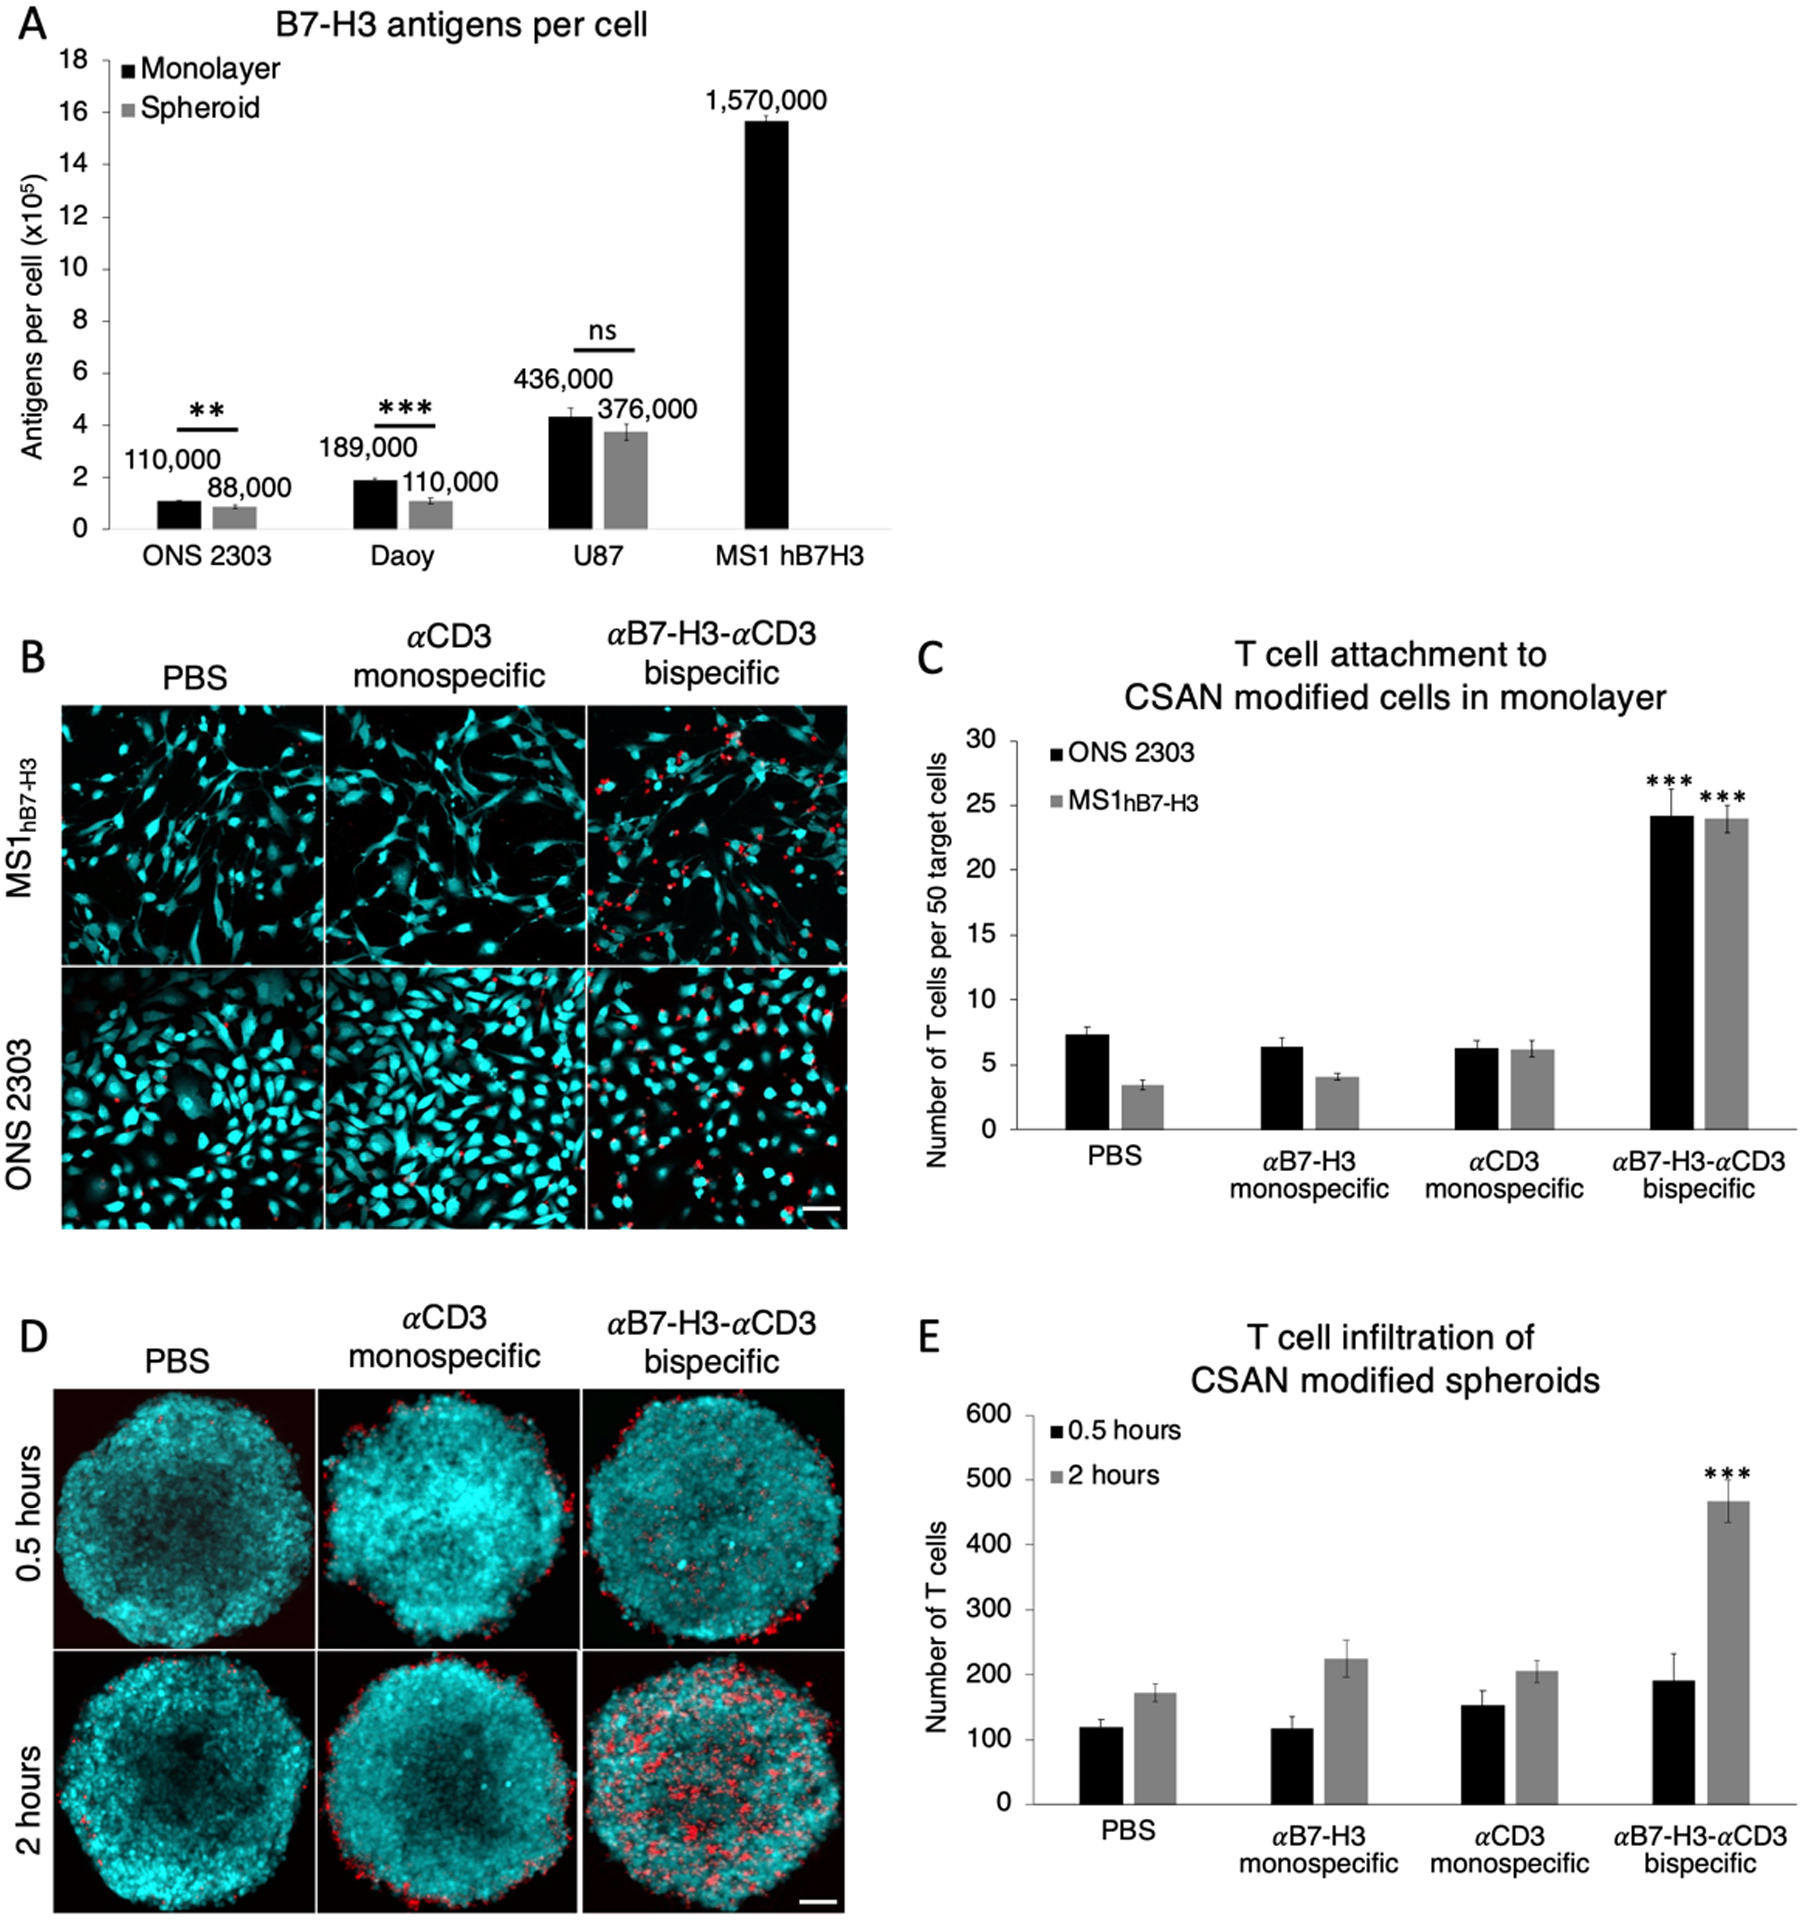
Figure 3.

αB7-H3-αCD3 bispecific CSANs increase T cell infiltration and attachment to B7-H3+ cells modified with CSANs. A, Quantification of B7-H3 antigen on different immortalized brain cancer cells cultured using different methods and the stably transfected MS1hB7-H3. (Data is displayed as mean ± SD, n = 3 technical replicates). A 2D monolayer of ONS 2303 allograft or MS1hB7-H3 cells were pre-incubated with monospecific or bispecific CSANs for 30 minutes at 37°C, after which unactivated T cells were added and the entire co-culture was incubated for 2 hours at 37°C. B, Representative composite fluorescent images of the co-culture for each cell line. Scale bar, 50μm. C, The number of T cells that remained attached to the monolayer after the 2 hour incubation were quantified using fluorescence microscopy (Data is displayed as mean ± SEM, *** P<0.0001 with respect to PBS and monospecific control CSANs by two-tailed unpaired t-test, n = 7–12 images each). 3D spheroids of ONS 2303 allograft cells were pre incubated with monospecific or bispecific CSANs for 30 minutes at 37°C, after which unactivated T cells were added and the entire co-culture was incubated for either 0.5 or 2 hours at 4°C. D, Representative z-projection images of the co-culture for each incubation time. Scale bar, 50μm. E, Z-stack images were acquired using fluorescent confocal microscopy to quantify the T cells that attached to and infiltrated the spheroids at the different incubation times (Data is displayed as mean ± SEM, *** P<0.0001 with respect to PBS and monospecific control CSANs by two-tailed unpaired t-test, n = 5–6 spheroids each).
