
Figure 7.
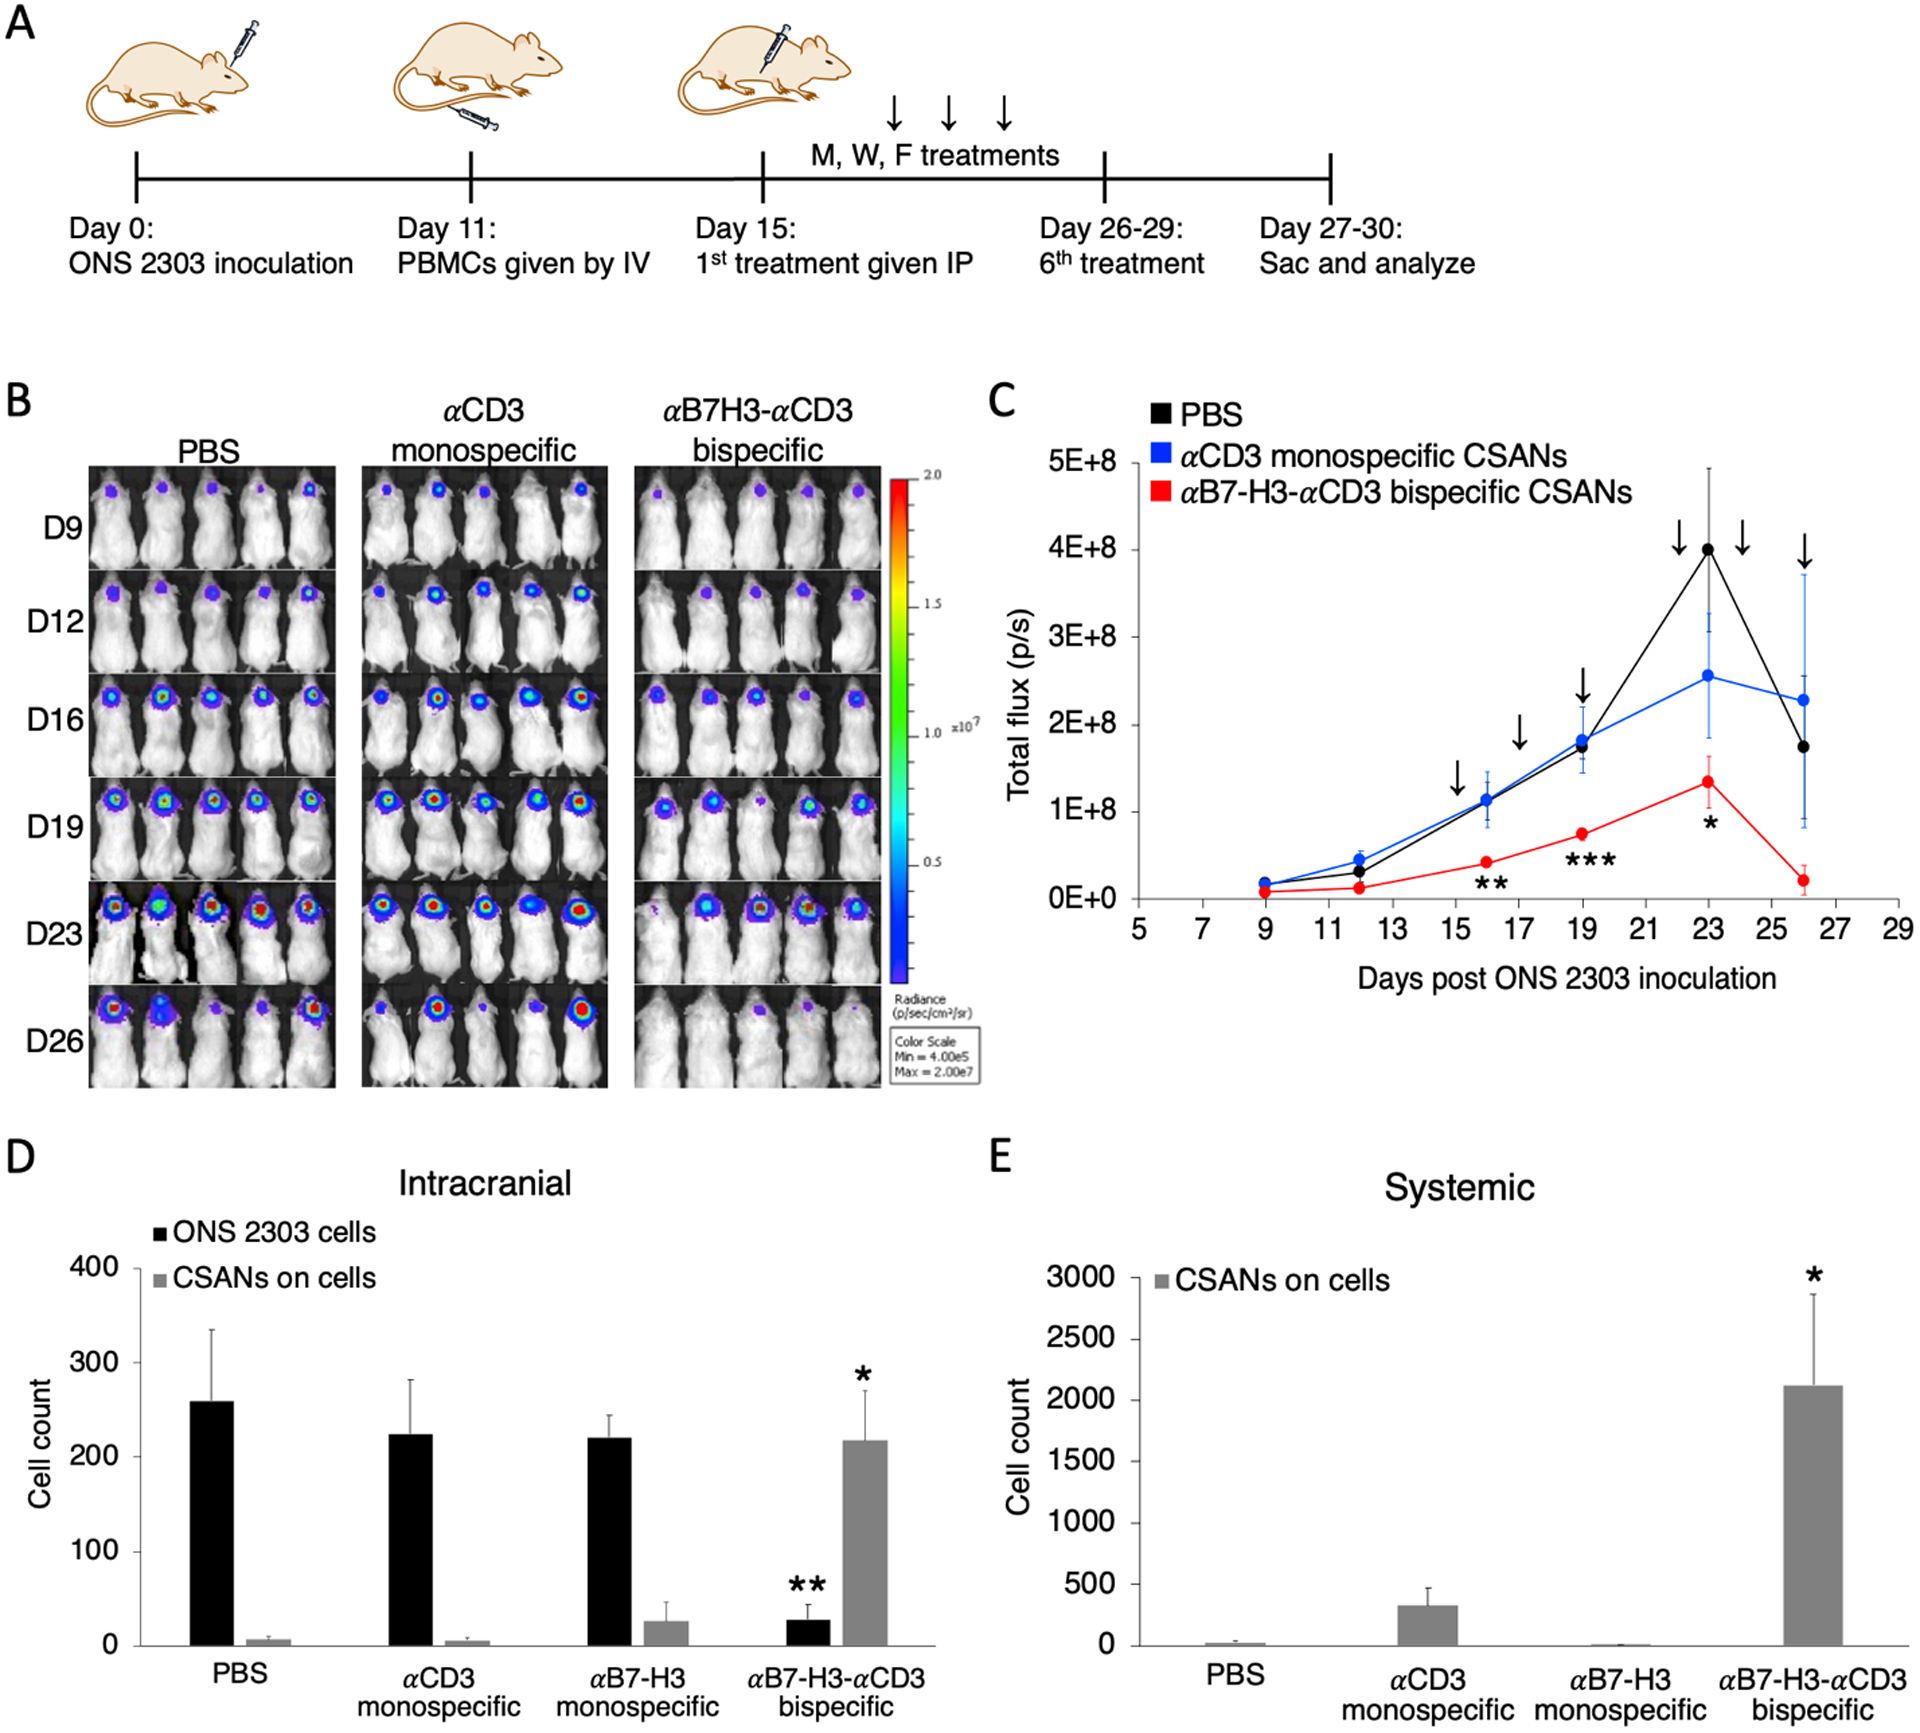
Systemically injected αB7-H3-αCD3 bispecific CSANs boost T cell protection for NRG mice against developing large orthotopic medulloblastoma tumors. A, Mouse model of orthotopic medulloblastoma. Intracranial injections were performed as previously described.48 1×10⁵ ONS 2303 cells were intracranially injected into the cerebellum of adult NRG mice. Tumor engraftment was monitored by bioluminescent imaging and, 11 days after tumor inoculation, 20×106 unactivated human PBMCs were IV injected. 4 days after PBMCs were given, mice received 1mg/kg CSAN treatments or PBS control IP injections. Booster injections were given every Monday, Wednesday, and Friday for 6 total treatments; the 6th treatment was staggered for some mice so that the flow cytometry analysis on live cells would happen about 24 hours after the final injection. B, Bioluminescent IVIS images of ONS 2303 tumors. C, Tumor progression was monitored by bioluminescent photometry where the average flux values (p/s, calculated by Living Image software) are shown for treatment and control groups (*P<0.05, **P<0.01, ***P<0.001 with respect to the PBS control by two-tailed unpaired t-test). D, A piece of the cerebellum that had been inoculated was removed and dissociated into a single cell suspension to enable measurements of viable ONS 2303 (GFP+ expression) and CSAN (Flag tag) presence on target brain and effector T cells by flow cytometry (**P<0.01, ***P<0.001 with respect to PBS and both monospecific control CSANs against each individual data series by two-tailed unpaired t-test). E, Blood was collected at the time of sacrifice and red blood cells were removed using ACK buffer. The remaining cell populations were analyzed for CSAN (Flag tag) presence by flow cytometry (*P<0.05 with respect to PBS and both monospecific control CSANs by two-tailed unpaired t-test). For every flow cytometry experiment, effector and target cells were determined by forward/side scatter and dead cells were removed using a viability dye (n = 5–7 mice per treatment group, data is displayed as mean ± SEM).