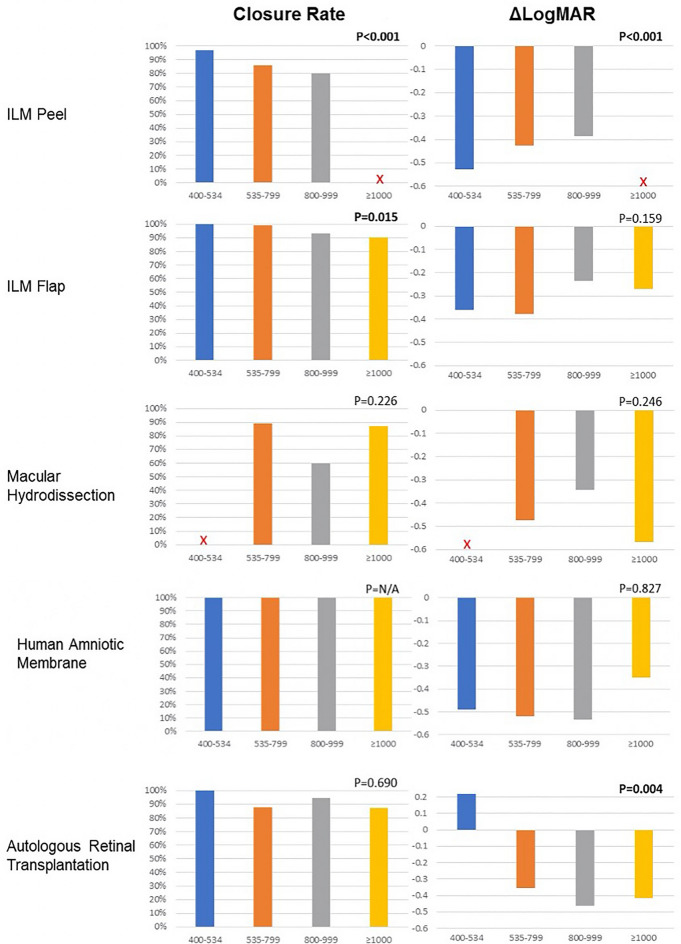
Fig. 4.
The graphs show the outcomes for each technique. Outcomes are categorized by the preoperative minimum linear diameter (MLD) measured on optical coherence tomography. The graphs on the left show the percentages of macular hole (MH) closure for each MLD size group. The graphs on the right show the improvement in the logarithm of the minimum angle of resolution (logMAR) (ΔlogMAR) visual acuity for MHs in each MLD size group. The X indicates MLD size groups with an insufficient number of eyes to be included in the analysis. ILM = internal limiting membrane

