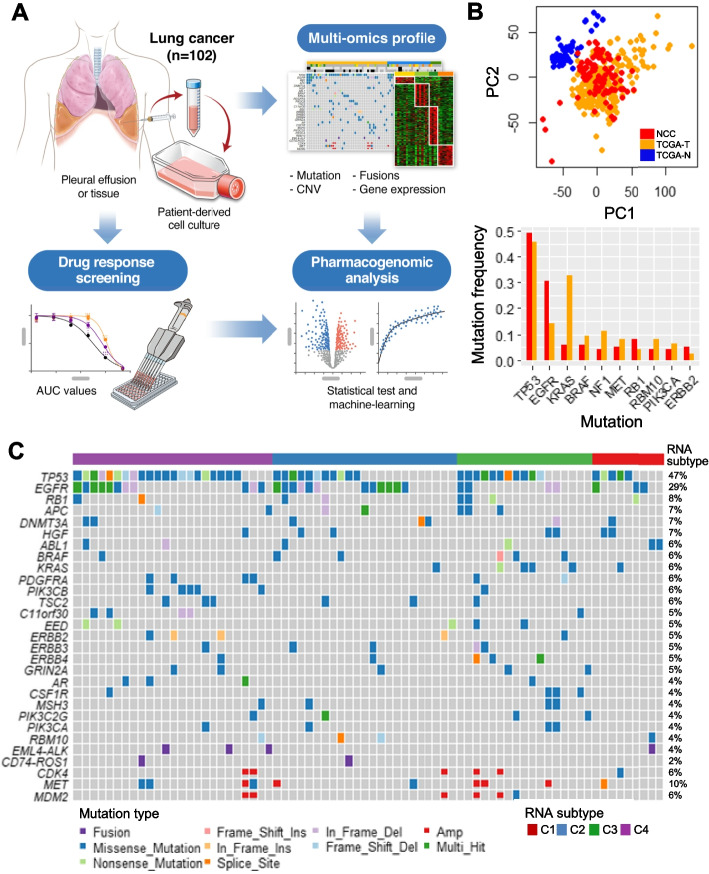
Fig. 1.
Genomic profiles of refractory lung cancer patient-derived cells (PDCs) for pharmacogenomic analysis. A Graphical workflow of pharmacogenomic analysis of lung cancer PDCs. B Gene expression and mutation profile comparison of our PDCs with TCGA samples. The scatterplot presents the principal component analysis for TCGA tumors, normal tissue samples, and PDCs. The bar plot indicates the mutation frequency of TCGA samples and PDCs. TCGA-T (orange) indicates tumor samples and TCGA-N (blue) indicates the adjacent normal tissue. C Genomic landscape heatmap of PDCs to harbor top-ranked somatic variants

