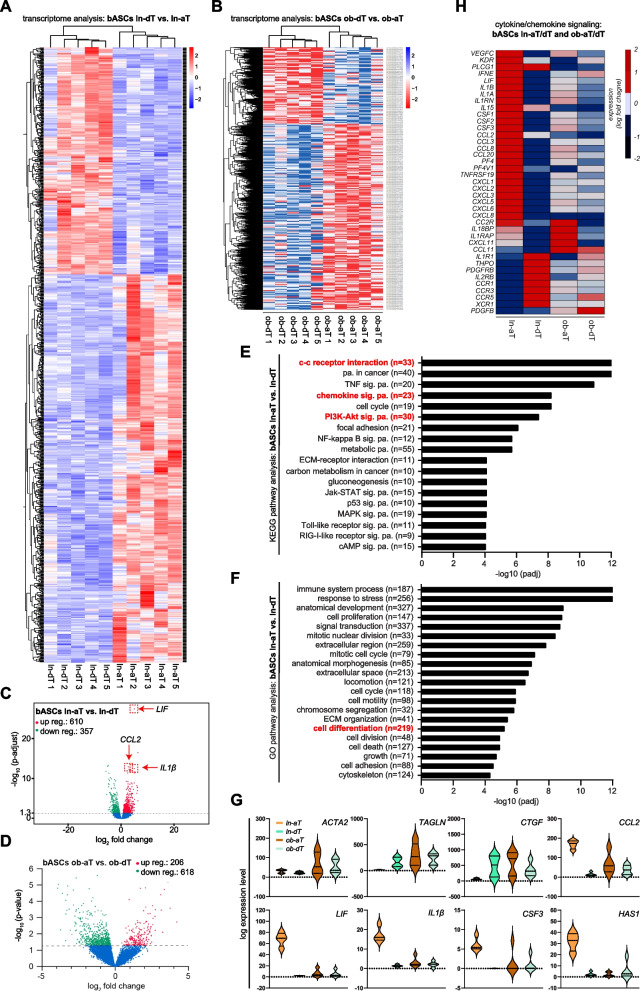
Fig. 3.
Transcriptomic profiles of lean and obese bASCs adjacent to breast cancers. A-G Total RNAs were extracted from each sample of bASC subgroups (ln-dT, ln-aT, ob-dT and ob-aT, 5 samples for each subgroup) for transcriptome analysis. A and B Heatmap of significantly differentially expressed genes of ln-dT vs. ln-aT bASCs (A) and ob-dT vs. ob-aT (B). Gene expression was analyzed using DESeq2 R package. Genes with a p-value < 0.01, and a fold change greater than 2 (red color code) and below − 2 (blue color code), respectively, were included. C and D Volcano plots showing the adjusted p-value (adj. p > 0.05) for genes differentially expressed between bASCs close to and distant to the breast cancers in lean (C) and obese (p > 0.05) (D) bASCs. Upregulated genes are depicted in red color, downregulated in green, and non-changed genes in blue (adjusted p-value > 0.05). E and F Significantly enriched KEGG pathways (E) and GO pathways (F) are presented for ln-aT bASCs compared to ln-dT bASCs. For each KEGG or GO pathway, the bar shows the adjusted p-value. The numbers (n) behind the pathway names indicate deregulated genes. G Violin plots present selected myCAF/iCAF genes differentially expressed. Values reflect the log expression levels of genes from the RNA-seq data. H Heatmap depicts significantly differentially expressed cytokine/chemokine genes in four bASCs subgroups. These genes have a fold change greater than 2 (red color code) or below − 2 (blue color code). Genes in (A-F) have an adjusted p-value of ≤0.05 and genes shown in (G) have an adjusted p-value of ≤0.05, at least for one condition (ln-aT or ob-aT)

