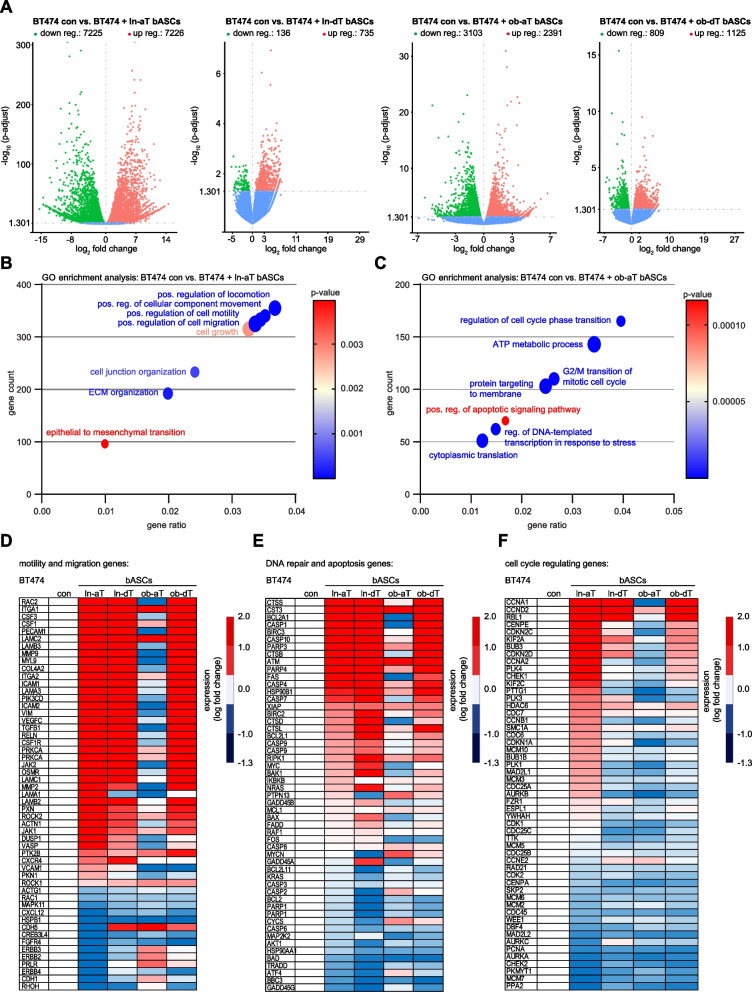
Fig. 6.
Transcriptome profiles of triple positive BT474 cells directly co-cultured with bASCs. A-F BT474 cells cultured for 14 days alone or in direct co-culture with different bASCs (ln/ob-dT/aT) were sorted for RNA-seq analysis (n = 3). The gene expression was analyzed using DESeq2 R package. A Volcano plots show the adjusted p-value for genes differentially expressed between control BT474 cells and BT474 cells directly co-cultured with ln-aT bASCs (1st volcano plot), ln-dT bASCs (2nd volcano plot), ob-aT bASCs (3rd volcano plot) and ob-dT bASCs (4th volcano plot). B and C GO enrichment analysis of RNA-seq data with a p-value ≤0.05. Gene count: the number of genes that are deregulated in the pathway. Gene ratio: ratio of the number of target genes divided by the number of all genes in each pathway. Significance is color coded as indicated (high p-value, red; low p-value, blue). D-F Heatmaps of deregulated genes involved in motility and migration (D), DNA repair and apoptosis (E), and cell cycle regulation (F). A fold change of ≥2 (red color code) and ≤ − 2 (blue color code) are shown. Included genes have a p-adjusted value of ≤0.05 for at least one condition (ln-aT or ob-aT)

