Fig. 7.
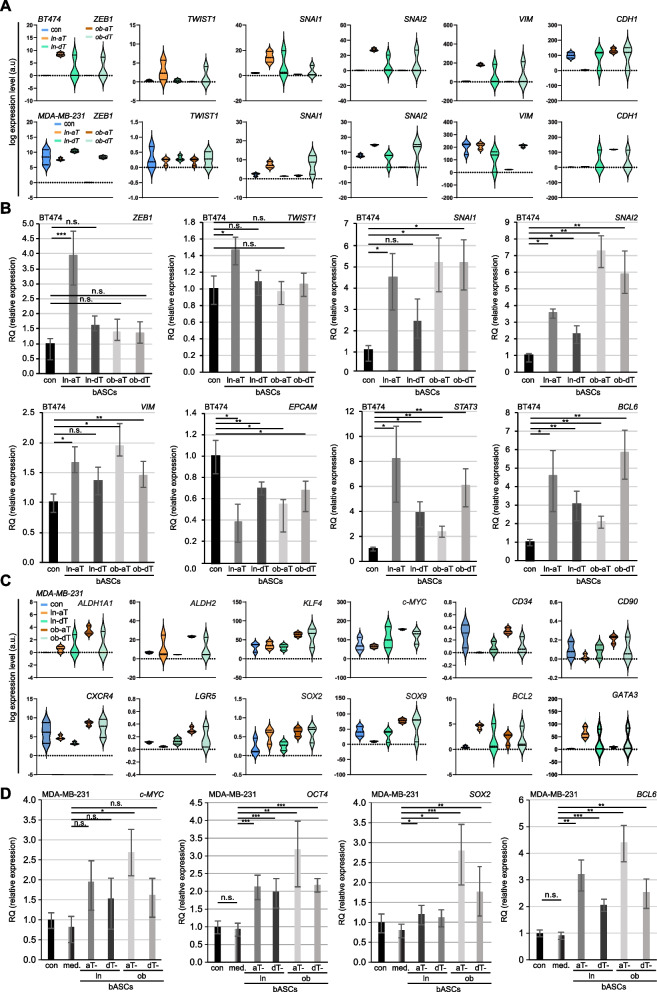
ln-aT bASCs induce the EMT in BT474 cells, whereas ob-aT bASCs stimulate MDA-MB-231 cells into a CSC phenotype. A and C BT474 and MDA-MB-231 cells were directly co-cultured with different bASCs (ln-aT, ln-dT, ob-aT and ob-dT) and were sorted for RNA-seq. Three independent experiments were performed for this analysis. A Representative violin plots show selected EMT marker genes. Values represent the log expression levels of genes from the RNA-seq data. Included genes have an adjusted p-value of ≤0.05 for at least one condition (ln-aT or ob-aT). B Relative levels of EMT-associated genes, including TWIST1, ZEB1, SNAI1, SNAI2, VIM, EPCAM, STAT3 and BCL6, are shown for different bASC subgroups (ln-dT, ln-aT, ob-dT and ob-aT). The results are from three independent experiments and presented as bar graphs with mean ± SEM. C Representative violin plots show selected CSC marker genes. Values represent the log expression levels of genes from the RNA-seq data. Included genes have an adjusted p-value of ≤0.05 for at least one condition (ln-aT or ob-aT). D Relative gene levels of CSC-associated genes c-MYC, OCT4, SOX2 and BCL6 are shown for different bASC subgroups (ln-dT, ln-aT, ob-dT and ob-aT). The results are from three independent experiments and presented as bar graphs with mean ± SEM. Student’s t test was used. *p < 0.05, **p < 0.01, ***p < 0.001

