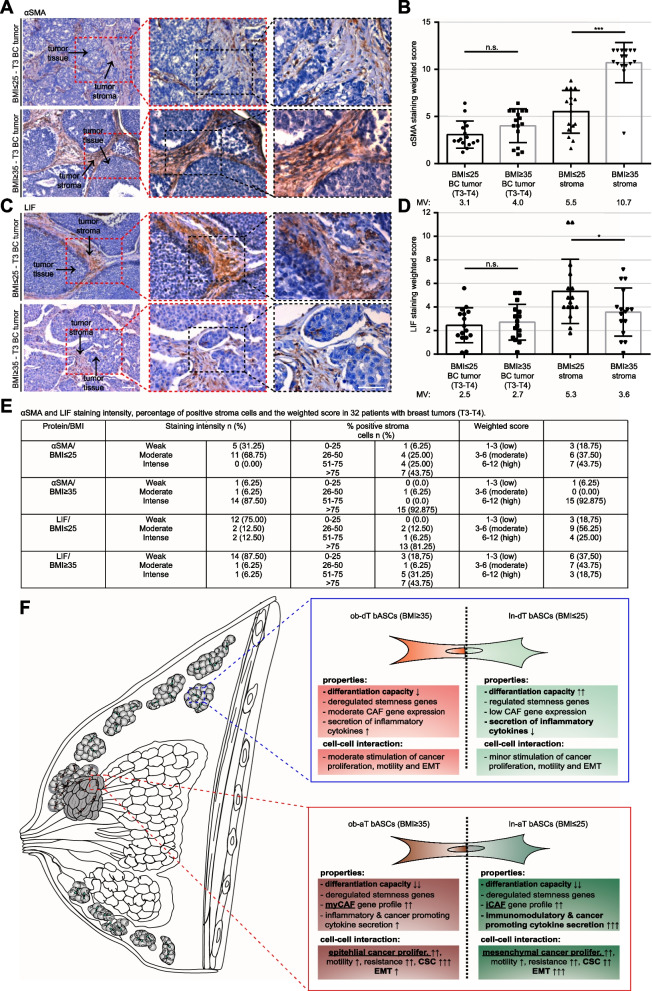
Fig. 8.
Increased αSMA and LIF in the cancer stroma from obese and lean patients, respectively. A and C Formalin-fixed and paraffin-embedded (FFPE) T3/4 breast cancer tissue sections of lean (BMI ≤ 25) or obese (BMI ≥ 35) patients were immunohistochemically stained with LIF (C) or αSMA (A) antibody (brown), respectively, and counterstained with hematoxylin (blue). Scale: 100 μm. Inset I and II scale: 50 μm. B and D Quantification of the weighted score in breast cancer cells and tumor stroma for LIF (D) and αSMA (B). The results are presented as bar and scatter plots showing the mean value ± SEM (n = 32, 16 lean / 16 obese breast cancer tissues). Student’s t test was used. *p < 0.05, ***p < 0.001. E Table depicts LIF and αSMA staining intensity, percentage of positive tumor stroma and weighted score in 32 breast cancer tissue sections. F Schematic illustration of the proposed working model. The breast cancer TME has a crucial impact on the properties of bASCs and on their cell-cell interaction capacity. The de-differentiation process within the TME is highly dependent on the cellular context and is influenced by BMI of patients. Both cancer-educated bASCs phenotypes, iCAF and myCAF, have drastic impacts on breast cancer cells, leading to different tumor promoting profiles in low and high malignant cancer cells

