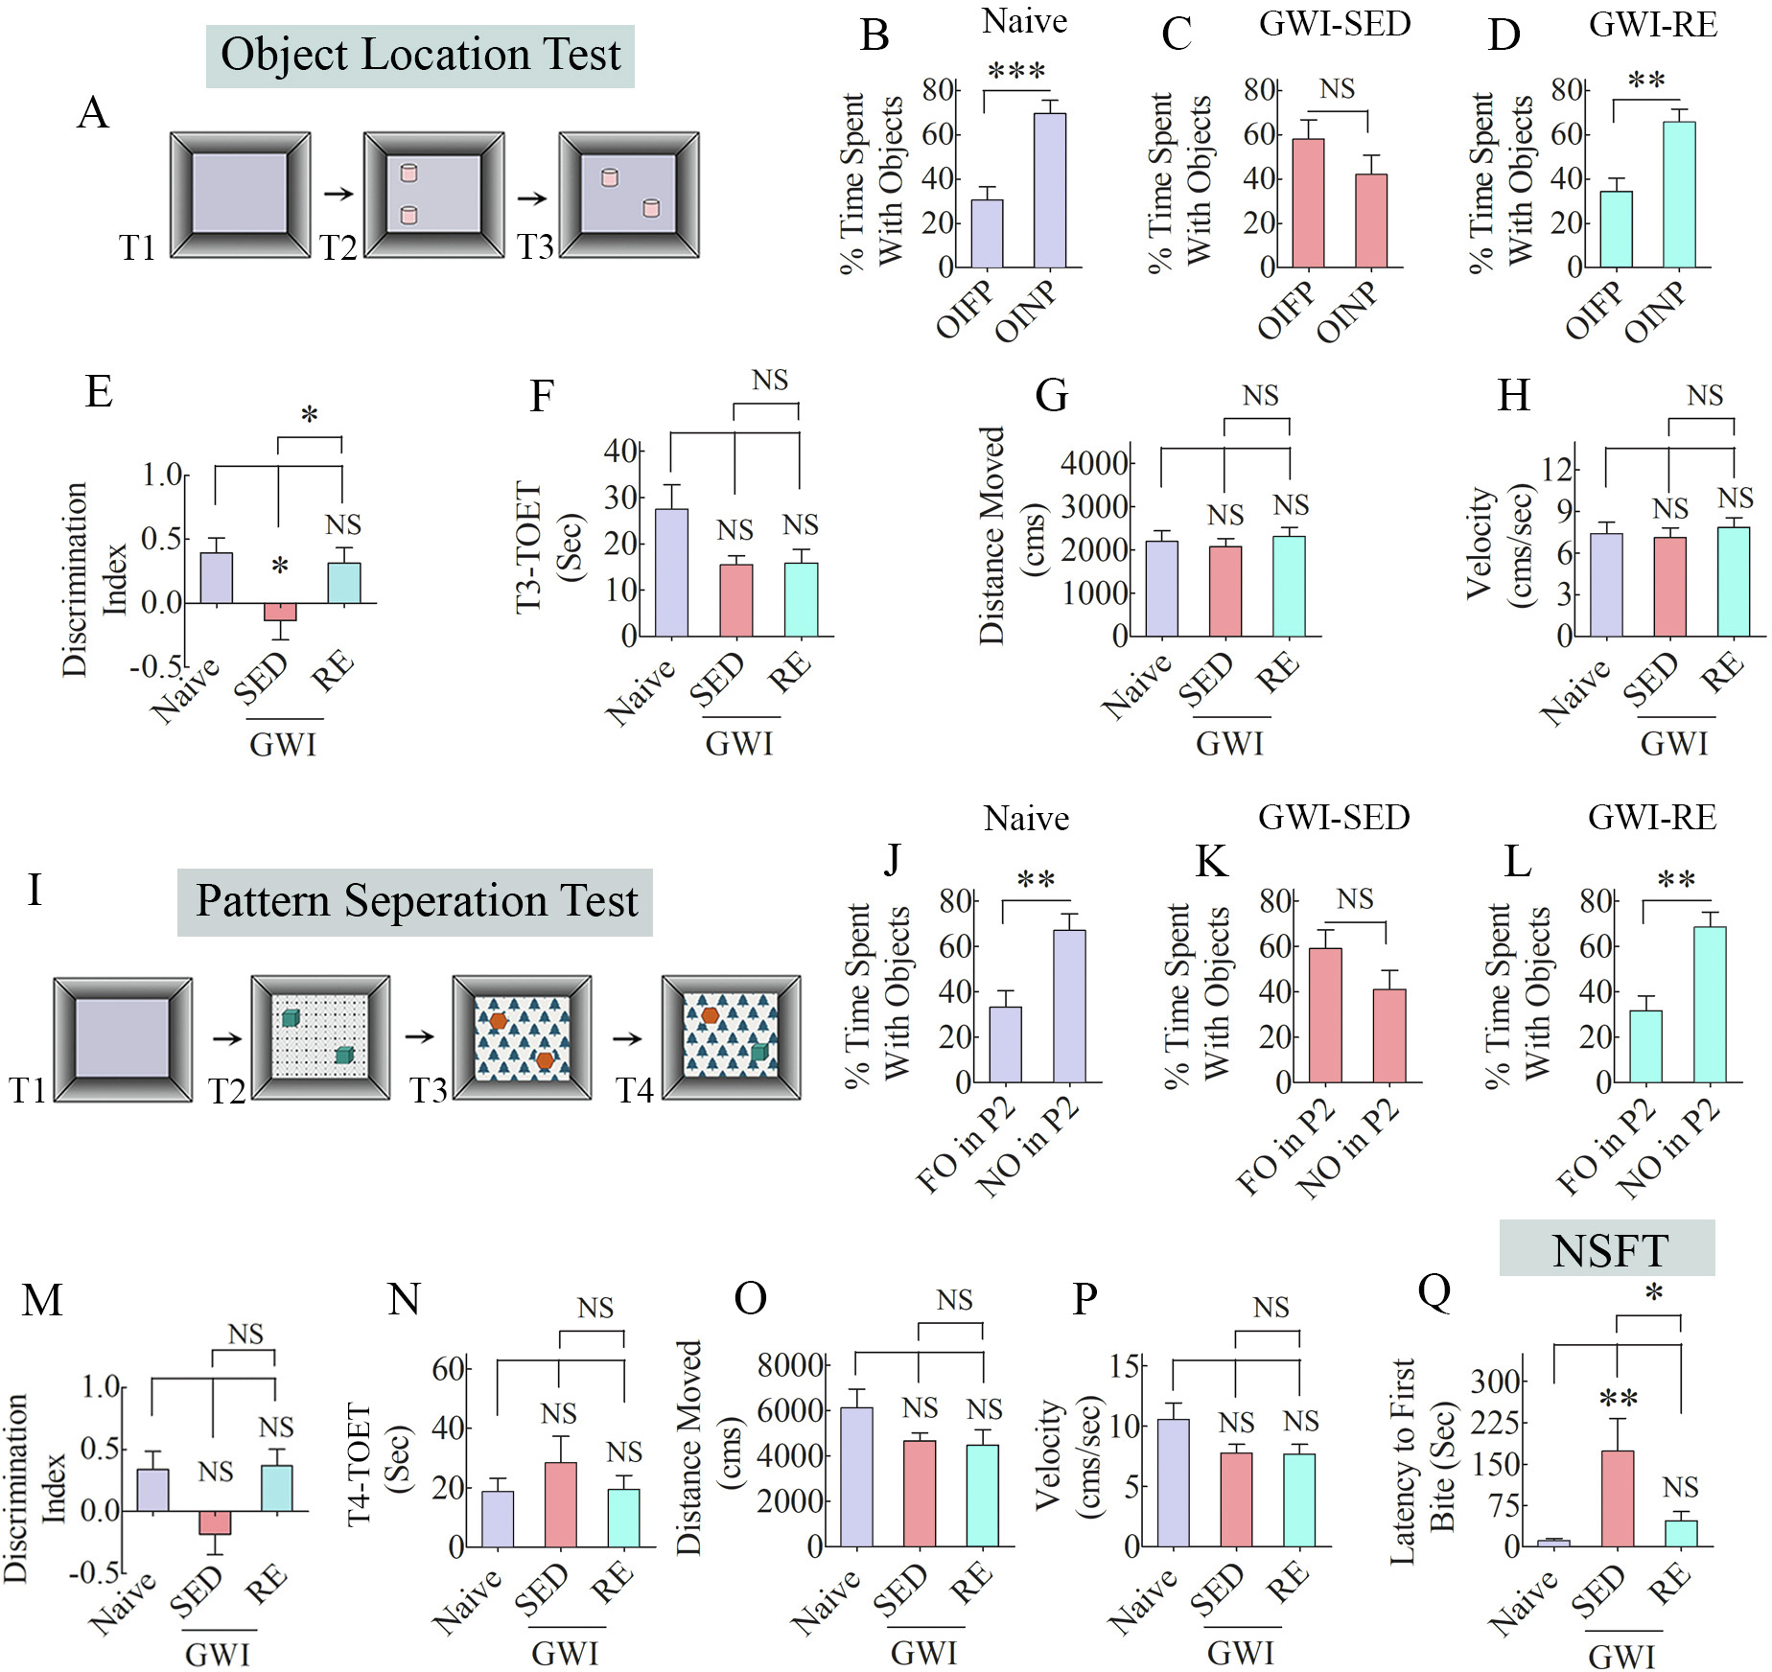
Fig. 2. Thirteen weeks of moderate, voluntary, intermittent running exercise (RE) improved cognitive and mood function in rats with Gulf War Illness (GWI).

The bar charts in the top two rows show the results of an object location test (OLT). Cartoon A shows the various phases involved in OLT, whereas the bar charts in B-D show the performance of animals belonging to naïve, sedentary GWI rats (GWI-SED) or GWI rats that performed RE (GWI-RE). The bar chart E compares the discrimination index across the three groups. The bar charts F-H compare the total object exploration times (TOETs; F), the distance traveled (G), and velocity of movement (H) in trial-3 (T3) between the three groups. The bar charts in rows 3–4 show the results of a pattern separation test (PST). The cartoon in I shows the various phases involved in PST, whereas the bar charts in J-L show the performance of animals belonging to different groups. Bar chart M compares the discrimination index across groups. The bar charts N-P compare TOETs (N), the distance moved (O), and the velocity of movement (P) in T4. The bar chart Q shows the results of a novelty suppressed feeding test. *, p < 0.05, **, p < 0.01, ***, p < 0.001.
