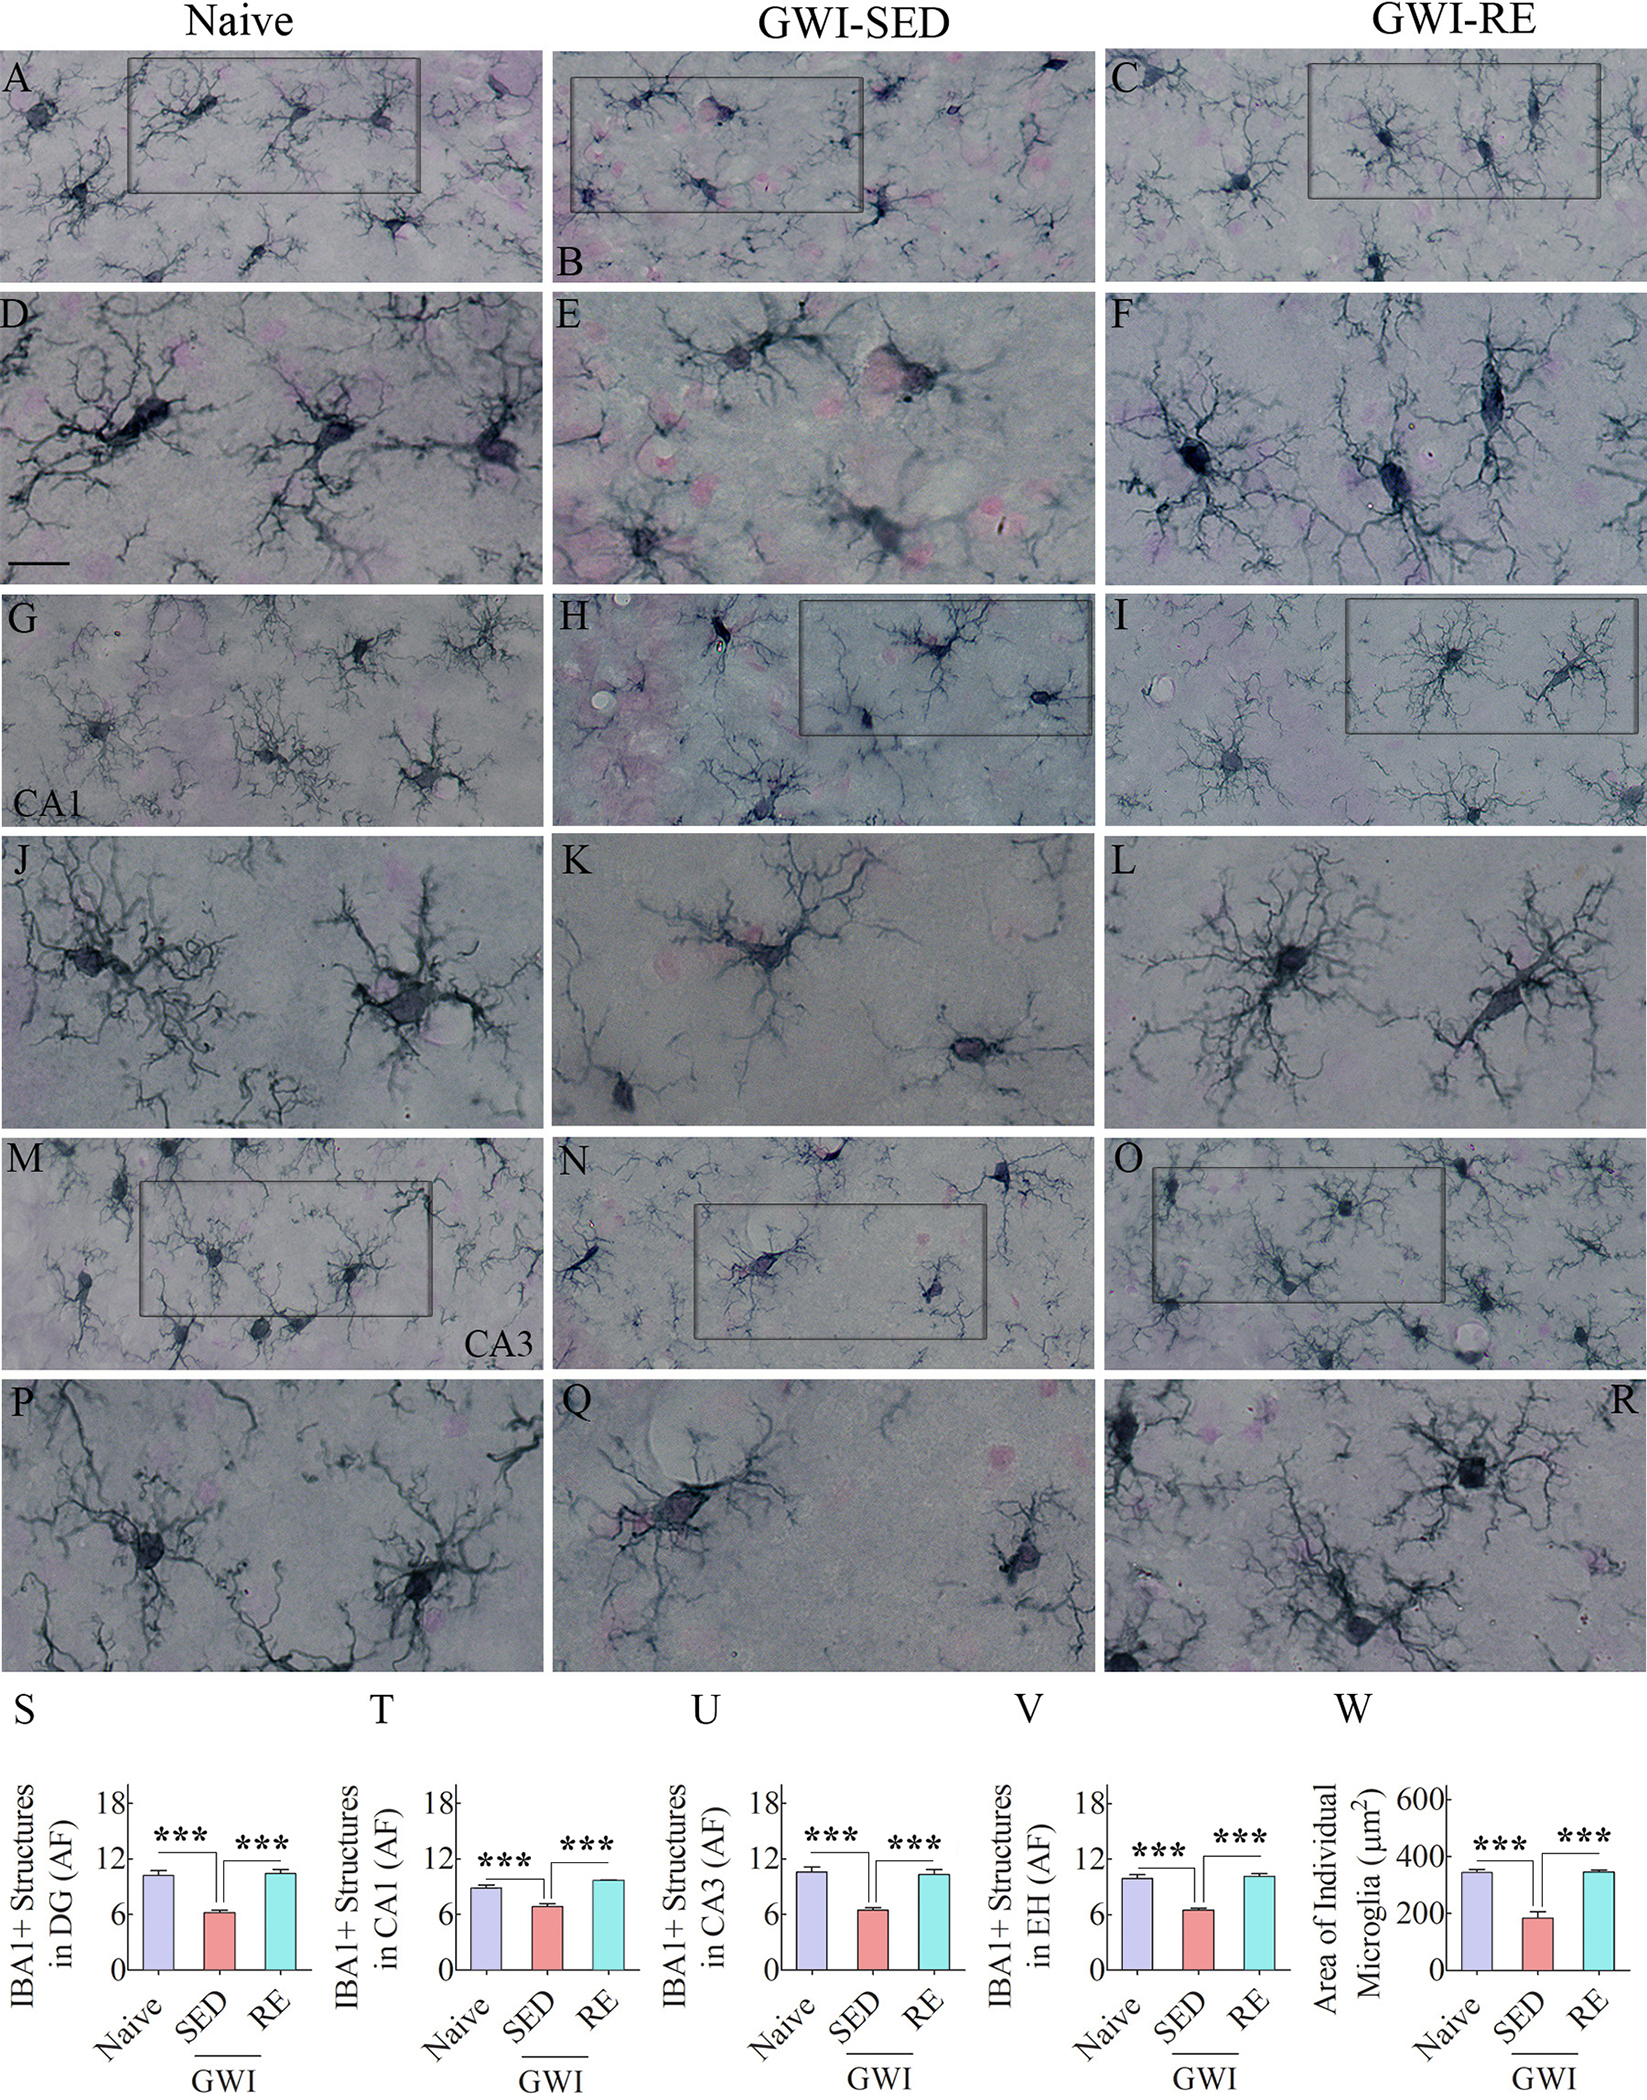
Fig. 3. Thirteen weeks of moderate voluntary, intermittent running exercise (RE) diminished activated microglia in the hippocampus of rats with Gulf War Illness (GWI).

Figures A-R show examples of IBA1 + microglia from naïve control rat (A, G, M), a sedentary GWI rat (GWI-SED; B, H, N), and a GWI rat that performed RE (GWI-RE; C, I, O) in the dentate gyrus (DG; A-C), the CA1 subfield (G-I), and the CA3 subfield (M–O) of the hippocampus. D-F, J-L, and P-R are magnified views of microglia from A-C, G-I, and M–O. The bar charts S-V compare the area fraction (AF) of IBA1 + structures in the DG (S), CA1 subfield (T), CA3 subfield (U), and the entire hippocampus (EH; V) between different groups. The bar chart W compares the area occupied by individual microglia in the CA1 subfield between different groups. Scale bar, A-C, G-I, and M–O = 25 μm; D-F, J-L, and P-R = 50 μm ***, p < 0.001.
